. 2013;9(3):e1003009.
doi: 10.1371/journal.pcbi.1003009. Epub 2013 Mar 28.

Origin and evolution of protein fold designs inferred from phylogenomic analysis of CATH domain structures in proteomes

Affiliations

Origin and evolution of protein fold designs inferred from phylogenomic analysis of CATH domain structures in proteomes

Syed Abbas Bukhari et al. PLoS Comput Biol. 2013.

Abstract

The spatial arrangements of secondary structures in proteins, irrespective of their connectivity, depict the overall shape and organization of protein domains. These features have been used in the CATH and SCOP classifications to hierarchically partition fold space and define the architectural make up of proteins. Here we use phylogenomic methods and a census of CATH structures in hundreds of genomes to study the origin and diversification of protein architectures (A) and their associated topologies (T) and superfamilies (H). Phylogenies that describe the evolution of domain structures and proteomes were reconstructed from the structural census and used to generate timelines of domain discovery. Phylogenies of CATH domains at T and H levels of structural abstraction and associated chronologies revealed patterns of reductive evolution, the early rise of Archaea, three epochs in the evolution of the protein world, and patterns of structural sharing between superkingdoms. Phylogenies of proteomes confirmed the early appearance of Archaea. While these findings are in agreement with previous phylogenomic studies based on the SCOP classification, phylogenies unveiled sharing patterns between Archaea and Eukarya that are recent and can explain the canonical bacterial rooting typically recovered from sequence analysis. Phylogenies of CATH domains at A level uncovered general patterns of architectural origin and diversification. The tree of A structures showed that ancient structural designs such as the 3-layer (αβα) sandwich (3.40) or the orthogonal bundle (1.10) are comparatively simpler in their makeup and are involved in basic cellular functions. In contrast, modern structural designs such as prisms, propellers, 2-solenoid, super-roll, clam, trefoil and box are not widely distributed and were probably adopted to perform specialized functions. Our timelines therefore uncover a universal tendency towards protein structural complexity that is remarkable.


Conflict of interest statement

The authors have declared that no competing interests exist.

Figures

Figure 1
Figure 1. Hierarchy of the CATH structural classification system compared to corresponding SCOP levels.
The architecture (A) level is unique to CATH.
Figure 2
Figure 2. Distribution of CATH domain structures among taxonomical groups of domain distribution in superkingdoms.
The percentage of domain structures shared by superkingdoms was considered as coarse estimate of evolutionary conservation of the hierarchical levels of classification. CATH domain censuses were derived from the present study. SCOP values were taken directly from published data , and involve 1030 Fs, 1740 FSF and 2,397 FF defined by SCOP v. 1.73.
Figure 3
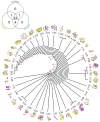
Figure 3. Phylogenomic tree of CATH A domain structures.
Optimal (P<0.01) most parsimonious A (26,323 steps; CI = 0.3738, RI = 0.7655; g1 = −0.427) tree was reconstructed from a protein domain census in 492 completely sequenced genomes. The phylogeny was plotted into circular tree diagram and cartoon representations of the core structures labeled with each CATH id were mapped onto the leaves of the tree. The Venn diagram shows the diversity of A in the three superkingdoms, Archaea, Bacteria and Eukarya.
Figure 4
Figure 4. Phylogenomic trees of CATH T (A) and H (B) domain structures.
Optimal (P<0.01) most-parsimonious T (392,769 steps; CI = 0.0251, RI = 0.7488; g1 = −0.169) and H (658,425 steps; CI = 0.0149, RI = 0.7444; g1 = −0.144) trees were reconstructed from a protein domain census in 492 completely sequenced genomes. The phylogenies reconstructed from a genomic census of 1,152 Ts and 2,221 Hs in 492 proteomes, where all 492 characters were parsimoniously informative. Terminal leaves are not labeled because they would not be legible. The Venn diagram shows the diversity of Ts and Hs in the three superkingdoms, Archaea, Bacteria and Eukarya.
Figure 5
Figure 5. Architectural chronologies of CATH A, T and H domain structures.
Three phases or epochs (I, II and III) in the timeline delimit the appearance, crystallization and diversification of As (A), Ts (B) and Hs (C) in all three superkingdoms (top panels) and in Archaea, Bacteria, and Eukarya (bottom panels). Individual plots show the relationship of f (distribution Index) and age of domain structures defined at A (ndA), T (ndT) and H (ndH) levels of structural abstraction.
Figure 6
Figure 6. Cumulative frequency plots of CATH H and T domain structures.
Cumulative frequency distribution plots plotted against the respective for T (A) and H (B) domain structures. Bottom plots show boxplots describing nd ranges for the seven taxonomic groups of T (C) and H (D) structures that are unique to individual superkingdom (A, B, E) or shared by two (AB, BE, AE) or all (ABE) superkingdoms. Numbers of T and H structures belonging to each taxonomic group are also indicated.
Figure 7
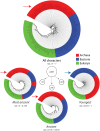
Figure 7. A phylogenomic tree of proteomes generated from the equally sampled dataset of FL proteomes.
The circular cladogram of the most parsimonious rooted tree describes the evolution of 123 equally sampled proteomes and was generated from genomic abundances of 2221 Hs. Terminal nodes of Archaea (A: 41 proteomes), Bacteria (B: 41), and Eukarya (E: 41) were labeled in red, blue, and green, respectively. Also the total character set was divided into three independent character sets e.g. Most Ancient (ndH 0∼0.176), Ancient (ndH 0.176∼0.318) and Younger (ndH 0.318∼1) characters set. These character sets resulted in three trees of proteomes that reflected the behavior of the tree over different character sets. Root branches are indicated with arrows.
Figure 8
Figure 8. The extent of synapomorphy exhibited by phylogenomic characters (H) in the trees of proteomes.
(A) Boxplots for retention index (RI) values of characters specific to seven taxonomical groups. (B) Mean RI for each taxonomical group was plotted with its standard error. (C) RI is plotted against the age (ndH) of each character, colored according to its specific taxonomical group. (D) RI is plotted against the f distribution index of each, same coloring scheme were used as of (C).
Figure 9
Figure 9. Architectural chronologies of CATH A domain structures colored according to structural design.
As shown in Table 1 we grouped the 38 As into 10 larger sets of general structural designs. As were plotted against their age (ndA) and f distribution indices, whereas each A was colored according to their general structural design group.
Figure 10
Figure 10. Cumulative frequency distributions of Ts and Hs belonging to a particular A along timeline of domain structures.
Plots A and B describe the evolutionary appearance of T and H domain structures, respectively. These two plots uncover patterns of diversification of structural designs in architectures over time. For example, the evolutionary accumulation of Ts and Hs belonging to the oldest architecture, the 3-layer (αβα) sandwich (3.40), occurs early but at different rates than Ts and Hs belonging to the orthogonal bundle (1.10) and 2-layer sandwich (3.30). The same pattern can be seen in (B), where the accumulation of the 4-layer sandwich (1.20) surpasses that of the α-β complex (3.90), even if 3.90 is more older than 1.20.

References

    1. Caetano-Anolles G, Wang M, Caetano-Anolles D, Mittenthal JE (2009) The origin, evolution and structure of the protein world. Biochem J 417: 621–637. - PubMed
    1. Andreeva A, Murzin AG (2006) Evolution of protein fold in the presence of functional constraints. Curr Opin Struct Biol 16: 399–408. - PubMed
    1. Worth CL, Gong S, Blundell TL (2009) Structural and functional constraints in the evolution of protein families. Nat Rev Mol Cell Biol 10: 709–720. - PubMed
    1. Csaba G, Birzele F, Zimmer R (2009) Systematic comparison of SCOP and CATH: A new gold standard for protein structure analysis. BMC Struct Biol 9: 23. - PMC - PubMed
    1. Murzin AG, Brenner SE, Hubbard T, Chothia C (1995) SCOP: A structural classification of proteins database for the investigation of sequences and structures. J Mol Biol 247: 536–540. - PubMed

Publication types