. 2013 Mar;9(3):e1003372.
doi: 10.1371/journal.pgen.1003372. Epub 2013 Mar 21.

Genetic architecture of skin and eye color in an African-European admixed population

Affiliations

Genetic architecture of skin and eye color in an African-European admixed population

Sandra Beleza et al. PLoS Genet. 2013 Mar.

Abstract

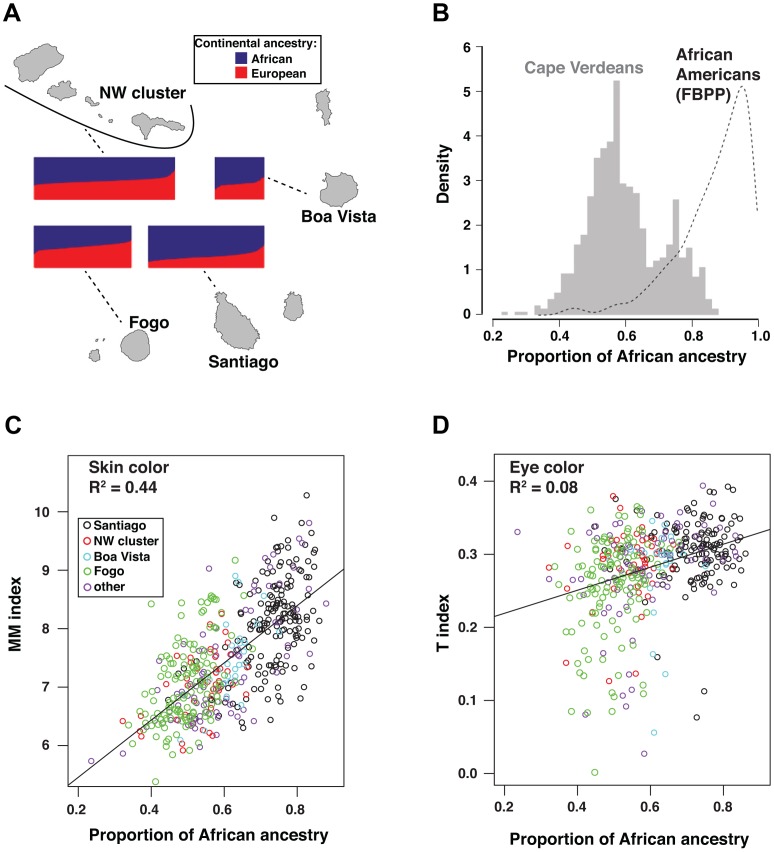
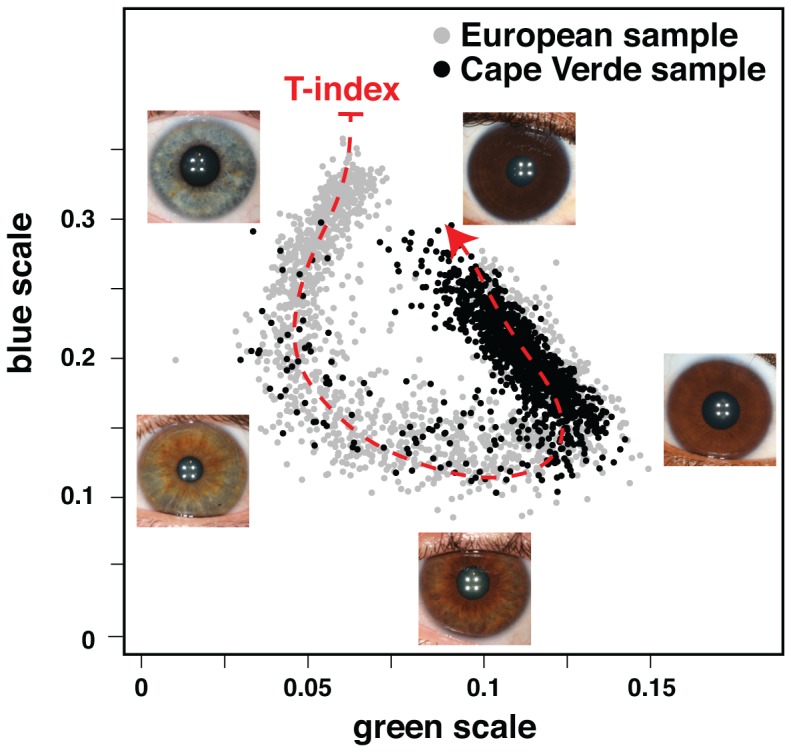
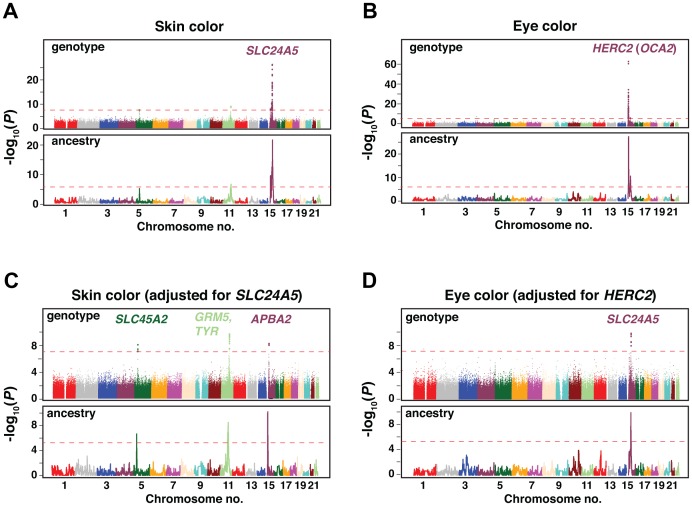
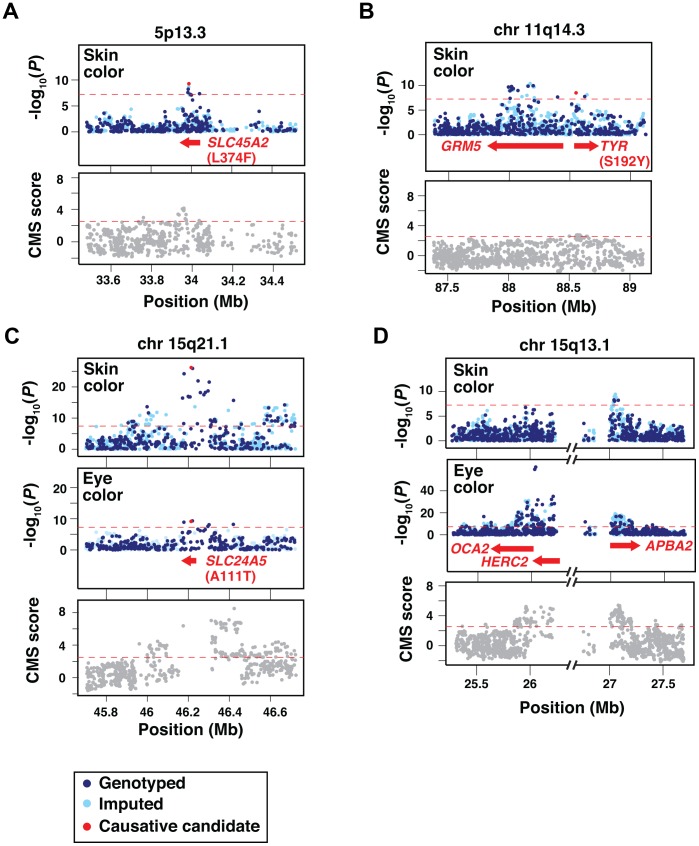
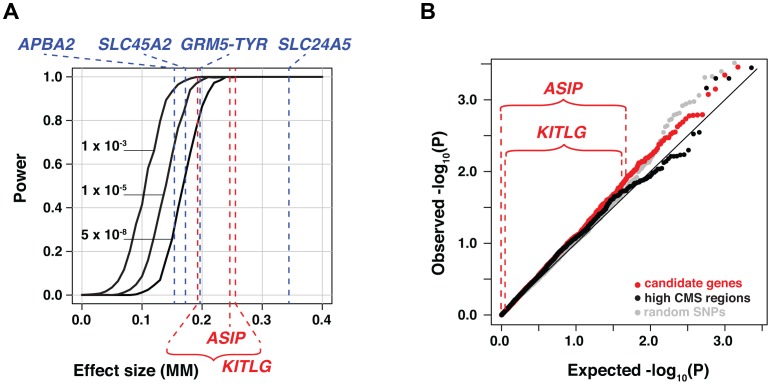
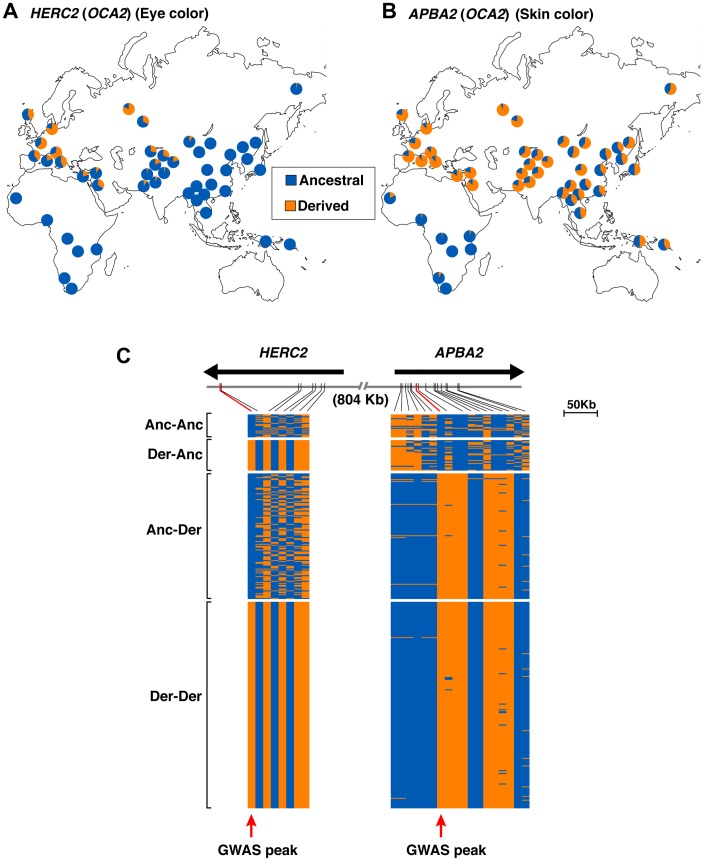
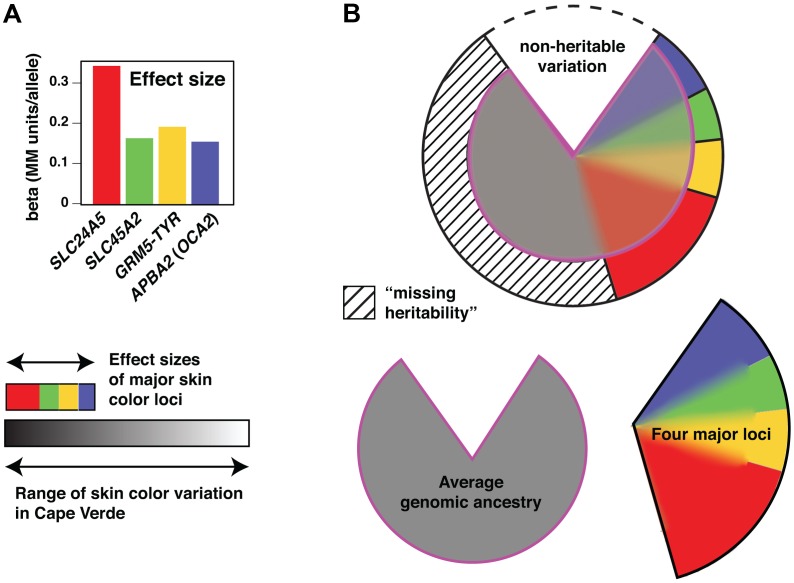
Variation in human skin and eye color is substantial and especially apparent in admixed populations, yet the underlying genetic architecture is poorly understood because most genome-wide studies are based on individuals of European ancestry. We study pigmentary variation in 699 individuals from Cape Verde, where extensive West African/European admixture has given rise to a broad range in trait values and genomic ancestry proportions. We develop and apply a new approach for measuring eye color, and identify two major loci (HERC2[OCA2] P = 2.3 × 10(-62), SLC24A5 P = 9.6 × 10(-9)) that account for both blue versus brown eye color and varying intensities of brown eye color. We identify four major loci (SLC24A5 P = 5.4 × 10(-27), TYR P = 1.1 × 10(-9), APBA2[OCA2] P = 1.5 × 10(-8), SLC45A2 P = 6 × 10(-9)) for skin color that together account for 35% of the total variance, but the genetic component with the largest effect (~44%) is average genomic ancestry. Our results suggest that adjacent cis-acting regulatory loci for OCA2 explain the relationship between skin and eye color, and point to an underlying genetic architecture in which several genes of moderate effect act together with many genes of small effect to explain ~70% of the estimated heritability.


Conflict of interest statement

The authors have declared that no competing interests exist.

Figures

Figure 1
Figure 1. Relationship of geography and ancestry to skin and eye color.
Individual ancestry proportions for Cape Verdeans displayed on all four panels were obtained from a supervised analysis in frappe with K = 2 and HapMap's CEU and YRI fixed as European and African parental populations. (a) Bar plots of individual ancestry proportions for Cape Verdeans across the islands. The width of the plots is proportional to sample size (Santiago, n = 172; Fogo, n = 129; NW cluster, n = 192; Boa Vista, n = 27). The proportion of African vs. European ancestry of the individuals is indicated by the proportion of blue vs. red color in each plot. (b) Individual African ancestry distribution in the total cohort of 685 Cape Verdeans (histogram) and in 802 African Americans (kernel density curve) from the Family Blood Pressure Program (FBPP) . (c) Scatter-plot of skin color vs. Individual African ancestry proportions. Skin color is measured by the MM index described in Material and Methods. (d) Scatter-plot of eye color vs. Individual African ancestry proportions. Eye color is measured by the T-index, described in Figure 2 and Material and Methods. Points in scatter-plots are color coded according to the island of origin of the individuals.
Figure 2
Figure 2. Quantitative assessment of eye color.
Plotted are the normalized median values of green (x-axis) and blue (y-axis) levels of each individual's irises. We fitted a principal curve that explains most of the variation in the data (red dashed curve). The T-index is defined by the arc-length from the projection of each point on the curve to the end of the curve that corresponds to the lightest eye color. In the figure are examples of eye photos at their respective position in the T-index curve.
Figure 3
Figure 3. GWAS results for skin and eye color in the total Cape Verdean cohort.
Results are shown as −log10(P value) for the genotyped SNPs. Plots are ordered by chromosomal position. (a,c) Genotype and admixture association scan results for skin color. (b,d) Genotype and admixture association scan results for eye color. (a,b) show the P values obtained in the initial scans and (c,d) the P values of the following scans adjusting for the strongest associated SNP (in SLC24A5 for skin color and in HERC2 for eye color). Dashed red lines correspond to the genome-wide significance threshold (P<5×10⁻⁸ in the genotype scan; P<7×10⁻⁶ in the ancestry scan [see Material and Methods]). The location and identity of candidate genes are colored to correspond with chromosomal location; individual SNPs are given in Table 1.
Figure 4
Figure 4. Imputation, fine-mapping, and selective signature scores for skin and eye color loci.
Each panel shows the genotype-association results and the distribution of Composite of Multiple Signals scores of positive selection (CMS scores) for genotyped and imputed SNPs (dark and light blue points in the association plots, respectively) surrounding the candidate loci; identities of individual SNPs are given in Table 1. Dashed red lines correspond to the genome-wide significance thresholds. (a) 5p13.3 region containing the SLC45A2 gene. (b) 11q14.3 region containing the GRM5 and TYR genes. (c) 15q21.1 region containing the SLC24A5 gene. (d) 15q13.1 region containing the OCA2, HERC2 and APBA2 genes. The interval between HERC2 and APBA2 contains a cluster of segmental duplications and a paucity of SNPs , and is also a source of a frequent deletion breakpoint as described in the Discussion. Previously identified candidate causative non-synonymous variants , , are denoted as red dots in the association plots of panels (a,b,c). The location and identity of candidate genes are colored to correspond with chromosomal location; individual SNPs are given in Table 1.
Figure 5
Figure 5. Power and candidate gene analyses.
(a) Power estimated at three different alpha levels, plotted as a function of effect size (number of MM units by which each copy of the derived allele lightens skin pigmentation). The results shown here are based on derived allele frequencies of 0.1 and 0.9 in the ancestral African and European populations, respectively. The effect sizes detected in Cape Verde for the four major skin color loci are shown in blue; effect sizes for ASIP and KITLG as estimated (see Material and Methods) from and , respectively are shown in red. (b) Distribution of P values for SNPs in 47 candidate genes, 16 regions with strong signatures of selection, and random SNPs, all shown as a q-q plot of the −log10 (P) values. Observed −log10 (P) values specifically for ASIP and KITLG SNPs are shown above the plot.
Figure 6
Figure 6. Allele frequency and haplotype analysis for eye and skin color loci at 15q13.1.
(a,b) Allele frequency distributions for the SNPs most significantly associated with eye [HERC2 rs1291382; (a)] and skin [APBA2 rs4424881; (b)] in the HapmapIII and HGDP panels for the old world. Blue/orange shading corresponds to the frequency of the ancestral/derived alleles, as determined by comparison with the chimp reference sequence (assembly CGSC2.1/pan Tro2). Frequency values are presented in Table S3. c) Visual displays of the haplotypes extending from HERC2 to the second intron of APBA2 in Europeans from HapMap phase III (CEU) and HGDP (French, French Basque, North Italian, Tuscan, Sardinian, Orcadian, and Russian) panels. Haplotypes were inferred on the basis of 26 SNPs common to both datasets; blue and orange shades represent the ancestral and derived alleles, respectively. Haplotypes were ordered according to the ancestral/derived states at HERC2 rs1291382 and APBA2 rs4424881 (marked with red arrows), as follows: haplotypes bearing the ancestral alleles for both SNPs (Anc-Anc); haplotypes bearing the derived allele for HERC2 rs1291382 and the ancestral allele for APBA2 rs4424881 (Der-Anc); haplotypes bearing the ancestral allele for HERC2 rs1291382 and the derived allele for APBA2 rs4424881 (Anc-Der); and haplotypes bearing the derived allele for both SNPs (Der-Der).
Figure 7
Figure 7. Genetic architecture of skin color variation.
(a) Effect sizes of the loci associated with skin color. Effect values represent the beta values obtained from a regression model containing the four associated loci plus ancestry. (b) The pie chart represents the proportion of phenotypic variation accounted for by the different components, including non-heritable factors (∼20%), the four major loci (∼35%, color-coded as in [a]), and average genomic ancestry (44%). The heritable contributions were estimated by regression and variance decomposition as described in Material and Methods, and are also represented below the pie chart separately as grey (genomic ancestry) or open (four major loci) areas. However, because of admixture stratification, the heritable contributions overlap as described in the text.

References

    1. Jablonski NG, Chaplin G (2000) The evolution of human skin coloration. J Hum Evol 39: 57–106. - PubMed
    1. Parra EJ (2007) Human pigmentation variation: evolution, genetic basis, and implications for public health. Am J Phys Anthropol (Suppl 45) 85–105. - PubMed
    1. Di Rienzo A, Hudson RR (2005) An evolutionary framework for common diseases: the ancestral-susceptibility model. Trends Genet 21: 596–601. - PubMed
    1. Sulem P, Gudbjartsson DF, Stacey SN, Helgason A, Rafnar T, et al. (2007) Genetic determinants of hair, eye and skin pigmentation in Europeans. Nat Genet 39: 1443–1452. - PubMed
    1. Sulem P, Gudbjartsson DF, Stacey SN, Helgason A, Rafnar T, et al. (2008) Two newly identified genetic determinants of pigmentation in Europeans. Nat Genet 40: 835–837. - PubMed

Publication types

Supplementary concepts

LinkOut - more resources