

Evaluation of ITA Graft Function Using CT Angiography
- PMID: 23555536
- PMCID: PMC3595855
- DOI: 10.3400/avd.oa.12.00028
Evaluation of ITA Graft Function Using CT Angiography
Abstract
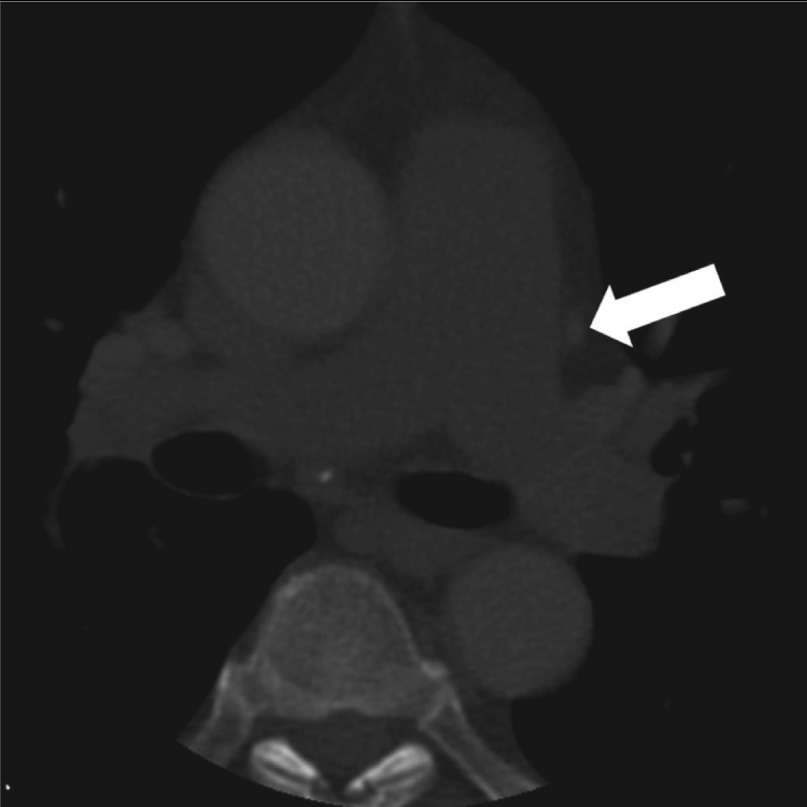
Objective: A less invasive method to assess internal thoracic artery (ITA) graft function after coronary artery bypass grafting (CABG) is desired. This study reports the novel method to estimate ITA graft function using CT angiography.
Materials and methods: Fifty ITA grafts were assessed. Hounsfield Unit transition of each graft on the same cross section was detected during the Test Bolus Injection, which led to the making of a time density curve (TDC), for each ITA. Variables from the TDC were compared statistically with data obtained from Pulse Doppler Echo (PDE), the best indicator of graft function, of ITA grafts.
Results: The ascending slope of the TDC was significantly associated with the following PDE data: Velocity time integral (VTI), VTI × Heart Rate (HR) and Mean Flow of ITA graft. A multivariate analysis showed an especially strong relationship with the ascending slope of the TDC and VTI × HR (R(2) = 0.588).
Conclusion: The ascending slope of the TDC means the concentration transition of contrast media, which may be affected by the blood stream in the ITA graft. This study suggests the possibility of the ability to assess ITA graft function by CT angiography.
Keywords: coronary artery bypass grafting; ct angiography; ita graft function; time density curve.
Figures


References
-
- Hamon M, Baron JC, Viader F, et al. Periprocedural stroke and cardiac catheterization. Circulation 2008; 118: 678-83 - PubMed
-
- Ropers D, Pohle FK, Kuettner A, et al. Diagnostic accuracy of noninvasive coronary angiography in patients after bypass surgery using 64-slice spiral computed tomography with 330-ms gantry rotation. Circulation 2006; 114: 2334-41, quiz 2334 - PubMed
-
- Laynez-Carnicero A, Estornell-Erill J, Trigo-Bautista A, et al. Non-invasive assessment of coronary artery bypass grafts and native coronary arteries using 64-slice computed tomography: comparison with invasive coronary angiography. Rev Esp Cardiol 2010; 63: 161-9 - PubMed
-
- Feuchtner GM, Schachner T, Bonatti J, et al. Diagnostic performance of 64-slice computed tomography in evaluation of coronary artery bypass grafts. AJR Am J Roentgenol 2007; 189: 574-80 - PubMed
-
- Jones CM, Athanasiou T, Tekkis PP, et al. Does Doppler echography have a diagnostic role in patency assessment of internal thoracic artery grafts? Eur J Cardiothorac Surg 2005; 28: 692-700 - PubMed
LinkOut - more resources
Full Text Sources