Clinical Trial
. 2013;8(3):e57924.
doi: 10.1371/journal.pone.0057924. Epub 2013 Mar 21.

Quantitative susceptibility mapping differentiates between blood depositions and calcifications in patients with glioblastoma

Affiliations
Clinical Trial

Quantitative susceptibility mapping differentiates between blood depositions and calcifications in patients with glioblastoma

Andreas Deistung et al. PLoS One. 2013.

Abstract

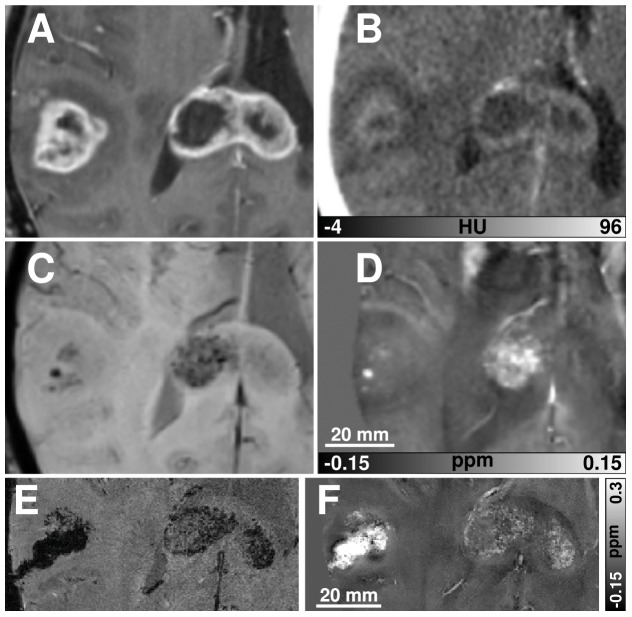
Objectives: The application of susceptibility weighted imaging (SWI) in brain tumor imaging is mainly used to assess tumor-related "susceptibility based signals" (SBS). The origin of SBS in glioblastoma is still unknown, potentially representing calcifications or blood depositions. Reliable differentiation between both entities may be important to evaluate treatment response and to identify glioblastoma with oligodendroglial components that are supposed to present calcifications. Since calcifications and blood deposits are difficult to differentiate using conventional MRI, we investigated whether a new post-processing approach, quantitative susceptibility mapping (QSM), is able to distinguish between both entities reliably.

Materials and methods: SWI, FLAIR, and T1-w images were acquired from 46 patients with glioblastoma (14 newly diagnosed, 24 treated with radiochemotherapy, 8 treated with radiochemotherapy and additional anti-angiogenic medication). Susceptibility maps were calculated from SWI data. All glioblastoma were evaluated for the appearance of hypointense or hyperintense correlates of SBS on the susceptibility maps.

Results: 43 of 46 glioblastoma presented only hyperintense intratumoral SBS on susceptibility maps, indicating blood deposits. Additional hypointense correlates of tumor-related SBS on susceptibility maps, indicating calcification, were identified in 2 patients being treated with radiochemotherapy and in one patient being treated with additional anti-angiogenic medication. Histopathologic reports revealed an oligodendroglial component in one patient that presented calcifications on susceptibility maps.

Conclusions: QSM provides a quantitative, local MRI contrast, which reliably differentiates between blood deposits and calcifications. Thus, quantitative susceptibility mapping appears promising to identify rare variants of glioblastoma with oligodendroglial components non-invasively and may allow monitoring the role of calcification in the context of different therapy regimes.


Conflict of interest statement

Competing Interests: The authors have declared that no competing interests exist.

Figures

Figure 1
Figure 1. Results of VOI analysis.
The signal intensity histograms (bin size = 10) of choroid plexus (n = 74) and SBS (n = 219) measured on susceptibility weighted images (SWI) in 46 GBM patients are shown in (a) and (b), respectively. The corresponding susceptibility differences of choroid plexus and SBS regions with respect to NAWM are shown in the histograms in (c) and (d), respectively, with a bin size of 0.03 ppm. (The white and grey bars indicate regions of the choroid plexus and SBS, respectively.)
Figure 2
Figure 2. MR images of a 71-year-old man with a left occipital untreated glioblastoma.
T1-w, FLAIR, SWI, and quantitative susceptibility map showing the same region are illustrated from (a) to (d), respectively.
Figure 3
Figure 3. Sections of MR images of the glioblastoma presented in Figure 2.
The top (a–c), middle (d–f), and bottom row (g–i) display sections of SW images, susceptibility maps, and overlays of the susceptibility maps onto the corresponding SW images, respectively. The columns from left to right sample the glioblastoma from inferior to superior direction with a slice distance of 2.5 mm. The location of these sections is indicated by the white rectangle in Figure 2c. The arrows and arrow heads indicate SBS and choroid plexus, respectively.
Figure 4
Figure 4. Imaging results of a 67-year-old female patient with a multilocular glioblastoma before radiochemotherapy.
The contrast-enhanced T1-w image reveals the typical ring-enhancement (a), whereas the susceptibility weighted image shows intratumoral SBS in the temporal lesion and in the right part of the corpus callosum (c). Corresponding SBS on the susceptibility map (d) are hyperintense, indicating blood products as the biophysical source of the intratumoral SBS. The contrast-enhanced CT image (b), displaying a comparable section, proves these findings because no calcifications can be identified as possible sources of the tumor-related SBS. A single slice of the high-resolution 7 T GRE magnitude data and the corresponding susceptibility map are displayed in (e) and (f), respectively. Since the 7 T data were acquired 10 days after the routine MRI, biopsy of the right temporal lesion had been performed in the meantime.
Figure 5
Figure 5. Images of a 49 year-old man with a glioblastoma with an oligodendroglial component after radiochemotherapy.
The contrast-enhanced T1-w and FLAIR images are presented in (a) and (b), respectively. SBS, indicated by the arrow and arrow head, are discernable on the SW image (c). The corresponding susceptibility map in (d) clearly suggests that these SBS are likely produced by calcium deposits (arrow) and blood products (arrow head).
Figure 6
Figure 6. Images of two patients who were treated with bevacizumab after completion of radiochemotherapy.
Images of a 42 year old man with a glioblastoma in the right occipital lobe (patient B1), who was treated with 12 cycles of bevacizumab after completion of radiochemotherapy are presented in the upper part (a–e). The lower part (f–j) reveals images of a 46 year old man with a glioblastoma in the frontal lobe (patient B2), who was treated with 5 cycles of bevacizumab. T1-weighted images before (a,f) and after contrast agent administration (b,g), FLAIR images (c,h), SW images (d,i) and susceptibility maps (e,j) are presented for each patient. The patient in the upper part represents SBS that only correlate with hyperintense areas on the susceptibility maps (arrow heads), whereas the patient in the lower part reveals additional calcifications indicated by hypointense correlates of SBS on susceptibility maps (arrows).

References

    1. Wen PY, Kesari S (2008) Malignant gliomas in adults. N Engl J Med 359: 492–507. - PubMed
    1. Wong ET, Hess KR, Gleason MJ, Jaeckle KA, Kyritsis AP, et al. (1999) Outcomes and prognostic factors in recurrent glioma patients enrolled onto phase II clinical trials. J Clin Oncol 17: 2572–2578. - PubMed
    1. Kim HS, Jahng GH, Ryu CW, Kim SY (2009) Added value and diagnostic performance of intratumoral susceptibility signals in the differential diagnosis of solitary enhancing brain lesions: preliminary study. AJNR Am J Neuroradiol 30: 1574–1579. - PMC - PubMed
    1. Toh CH, Wei KC, Chang CN, Hsu PW, Wong HF, et al. (2012) Differentiation of Pyogenic Brain Abscesses from Necrotic Glioblastomas with Use of Susceptibility-Weighted Imaging. AJNR Am J Neuroradiol 33 (8) 1534–8. - PMC - PubMed
    1. Sehgal V, Delproposto Z, Haddar D, Haacke EM, Sloan AE, et al. (2006) Susceptibility-weighted imaging to visualize blood products and improve tumor contrast in the study of brain masses. J Magn Reson Imaging 24: 41–51. - PubMed

Publication types

MeSH terms