A broad profile of co-dominant epitopes shapes the peripheral Mycobacterium tuberculosis specific CD8+ T-cell immune response in South African patients with active tuberculosis
- PMID: 23555576
- PMCID: PMC3608651
- DOI: 10.1371/journal.pone.0058309
A broad profile of co-dominant epitopes shapes the peripheral Mycobacterium tuberculosis specific CD8+ T-cell immune response in South African patients with active tuberculosis
Abstract
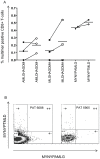
We studied major histocompatibility complex (MHC) class I peptide-presentation and nature of the antigen-specific CD8+ T-cell response from South African tuberculosis (TB) patients with active TB. 361 MHC class I binding epitopes were identified from three immunogenic TB proteins (ESAT-6 [Rv3875], Ag85B [Rv1886c], and TB10.4 [Rv0288], including amino acid variations for Rv0288, i.e., A10T, G13D, S27N, and A71S for MHC allotypes common in a South African population (e.g., human leukocyte antigen [HLA]-A*30, B*58, and C*07). Inter-allelic differences were identified regarding the broadness of the peptide-binding capacity. Mapping of frequencies of Mycobacterium tuberculosis (M. tb) antigen-specific CD8+ T-cells using 48 different multimers, including the newly constructed recombinant MHC class I alleles HLA-B*58:01 and C*0701, revealed a low frequency of CD8+ T-cell responses directed against a broad panel of co-dominant M. tb epitopes in the peripheral circulation of most patients. The antigen-specific responses were dominated by CD8+ T-cells with a precursor-like phenotype (CD45RA+CCR7+). The data show that the CD8+ T-cell response from patients with pulmonary TB (prior to treatment) is directed against subdominant epitopes derived from secreted and non-secreted M. tb antigens and that variant, natural occurring M. tb Rv0288 ligands, have a profound impact on T-cell recognition.
Conflict of interest statement
Figures


Similar articles
-
Antigens for CD4 and CD8 T cells in tuberculosis.Cold Spring Harb Perspect Med. 2014 May 22;4(7):a018465. doi: 10.1101/cshperspect.a018465. Cold Spring Harb Perspect Med. 2014. PMID: 24852051 Free PMC article. Review.
-
Mycobacterium tuberculosis-specific and MHC class I-restricted CD8+ T-cells exhibit a stem cell precursor-like phenotype in patients with active pulmonary tuberculosis.Int J Infect Dis. 2015 Mar;32:13-22. doi: 10.1016/j.ijid.2014.12.017. Int J Infect Dis. 2015. PMID: 25809750
-
Extensive major histocompatibility complex class I binding promiscuity for Mycobacterium tuberculosis TB10.4 peptides and immune dominance of human leucocyte antigen (HLA)-B*0702 and HLA-B*0801 alleles in TB10.4 CD8 T-cell responses.Immunology. 2010 Apr;129(4):496-505. doi: 10.1111/j.1365-2567.2009.03201.x. Epub 2009 Nov 25. Immunology. 2010. PMID: 20002212 Free PMC article.
-
Frequency of Mycobacterium tuberculosis-specific CD8+ T-cells in the course of anti-tuberculosis treatment.Int J Infect Dis. 2015 Mar;32:23-9. doi: 10.1016/j.ijid.2015.01.017. Int J Infect Dis. 2015. PMID: 25809751
-
Genome wide approaches discover novel Mycobacterium tuberculosis antigens as correlates of infection, disease, immunity and targets for vaccination.Semin Immunol. 2018 Oct;39:88-101. doi: 10.1016/j.smim.2018.07.001. Epub 2018 Jul 7. Semin Immunol. 2018. PMID: 30327124 Review.
Cited by
-
Host directed therapies (HDTs) and immune response signatures: insights into a role for interleukin-32.Ann Transl Med. 2015 May;3(Suppl 1):S37. doi: 10.3978/j.issn.2305-5839.2015.03.65. Ann Transl Med. 2015. PMID: 26046084 Free PMC article. No abstract available.
-
Selection of a Single Domain Antibody, Specific for an HLA-Bound Epitope of the Mycobacterial Ag85B Antigen.Front Immunol. 2020 Oct 2;11:577815. doi: 10.3389/fimmu.2020.577815. eCollection 2020. Front Immunol. 2020. PMID: 33117380 Free PMC article.
-
Human and Murine Clonal CD8+ T Cell Expansions Arise during Tuberculosis Because of TCR Selection.PLoS Pathog. 2015 May 6;11(5):e1004849. doi: 10.1371/journal.ppat.1004849. eCollection 2015 May. PLoS Pathog. 2015. PMID: 25945999 Free PMC article.
-
Cytotoxic response persists in subjects treated for tuberculosis decades ago.BMC Infect Dis. 2013 Dec 5;13:573. doi: 10.1186/1471-2334-13-573. BMC Infect Dis. 2013. PMID: 24308801 Free PMC article.
-
Antigens for CD4 and CD8 T cells in tuberculosis.Cold Spring Harb Perspect Med. 2014 May 22;4(7):a018465. doi: 10.1101/cshperspect.a018465. Cold Spring Harb Perspect Med. 2014. PMID: 24852051 Free PMC article. Review.
References
-
- WHO (2011) WHO Report 2011. Global tuberculosis control Geneva, Switzerland: WHO/HTM/TB/2011.2016.
-
- Zumla A, Atun R, Maeurer M, Mwaba P, Ma Z, et al. (2011) Viewpoint: Scientific dogmas, paradoxes and mysteries of latent Mycobacterium tuberculosis infection. Trop Med Int Health 16: 79–83. - PubMed
-
- Wolkers MC, Brouwenstijn N, Bakker AH, Toebes M, Schumacher TN (2004) Antigen bias in T cell cross-priming. Science 304: 1314–1317. - PubMed
Publication types
MeSH terms
Substances
LinkOut - more resources
Full Text Sources
Other Literature Sources
Research Materials

