. 2013;8(3):e58832.
doi: 10.1371/journal.pone.0058832. Epub 2013 Mar 28.

Light-induced translocation of RGS9-1 and Gβ5L in mouse rod photoreceptors

Affiliations

Light-induced translocation of RGS9-1 and Gβ5L in mouse rod photoreceptors

Mei Tian et al. PLoS One. 2013.

Abstract

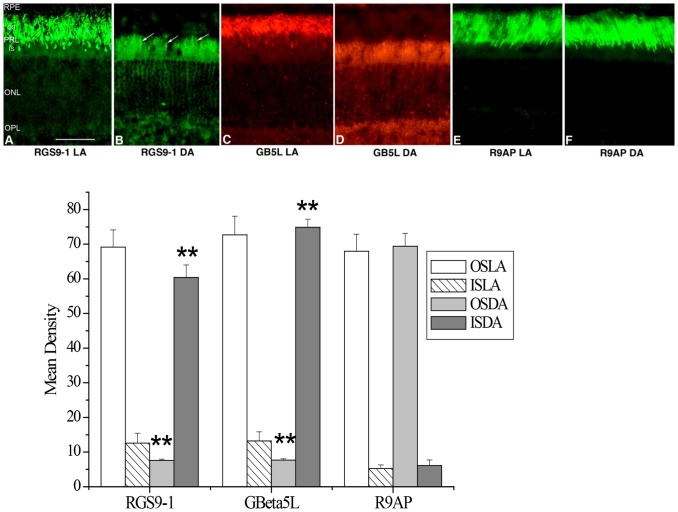
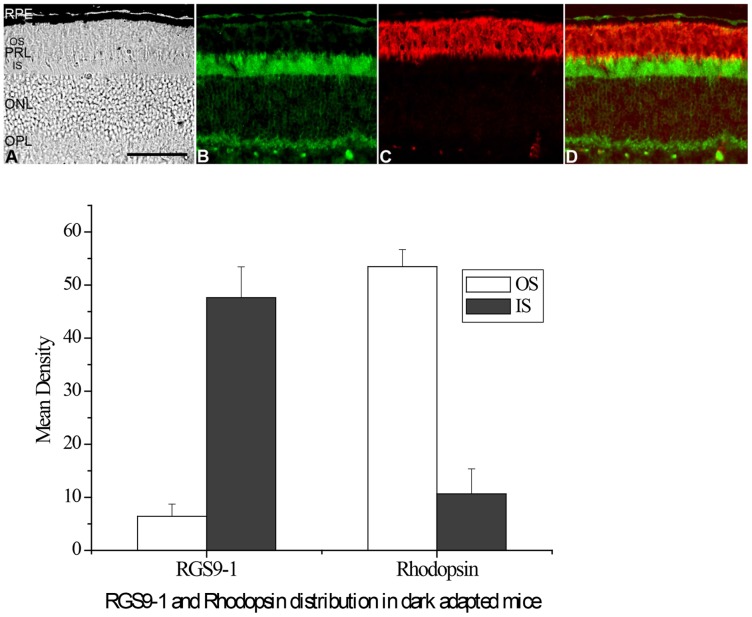
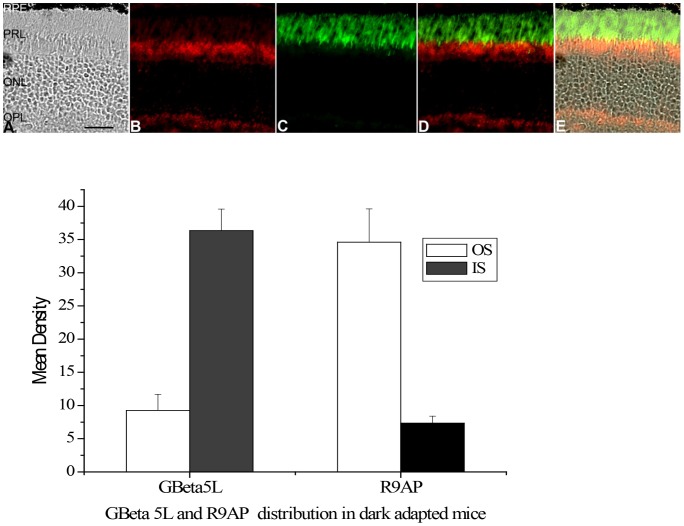
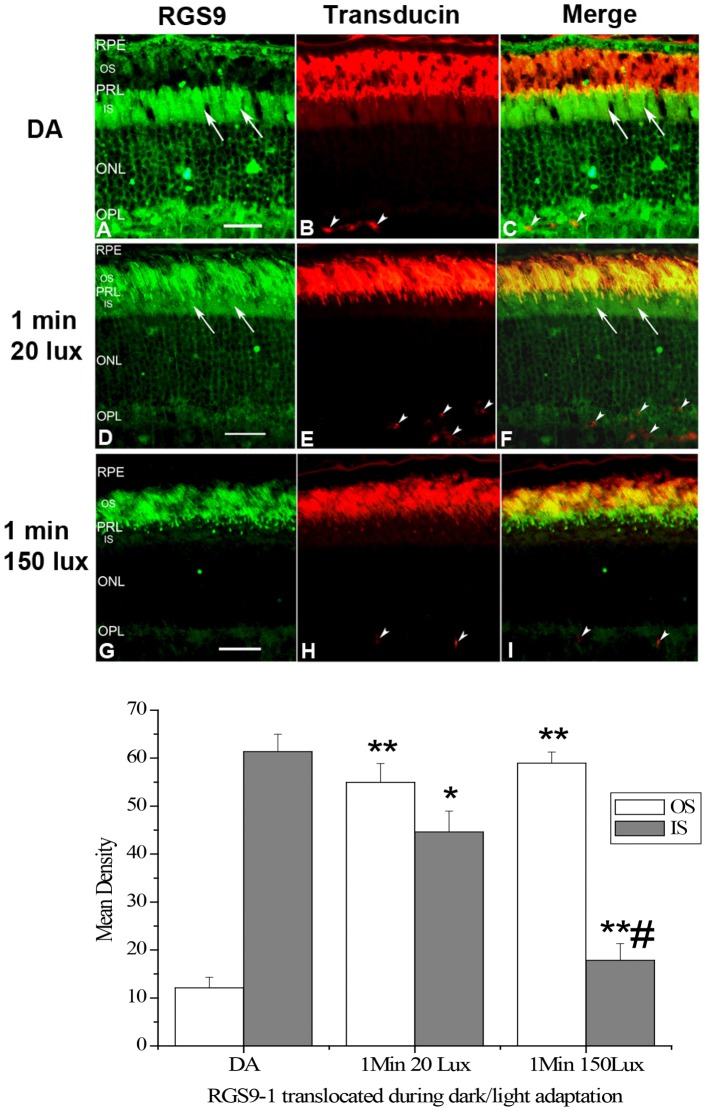
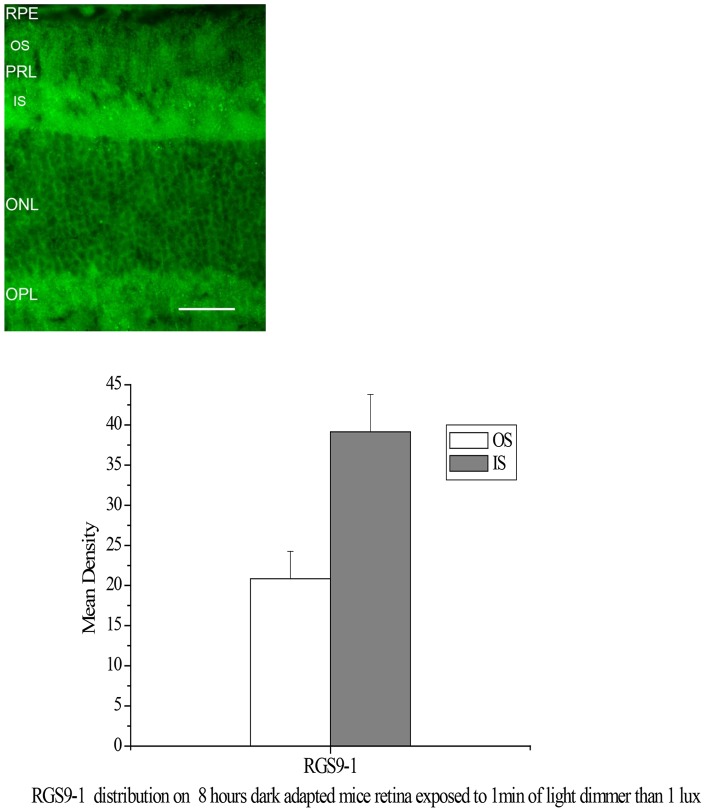
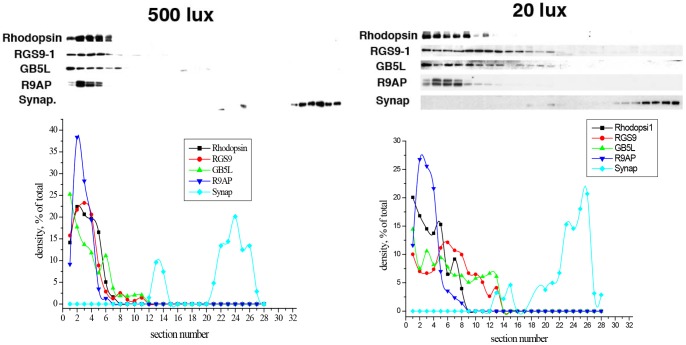
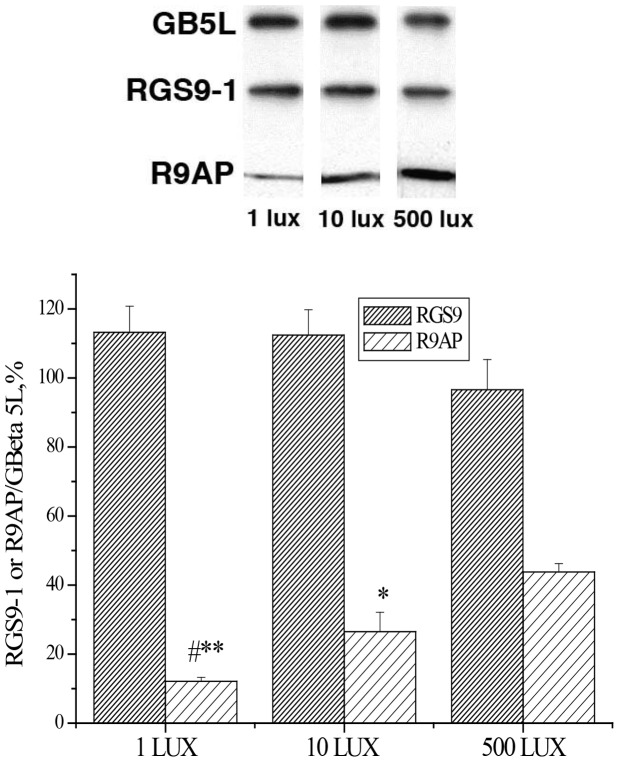
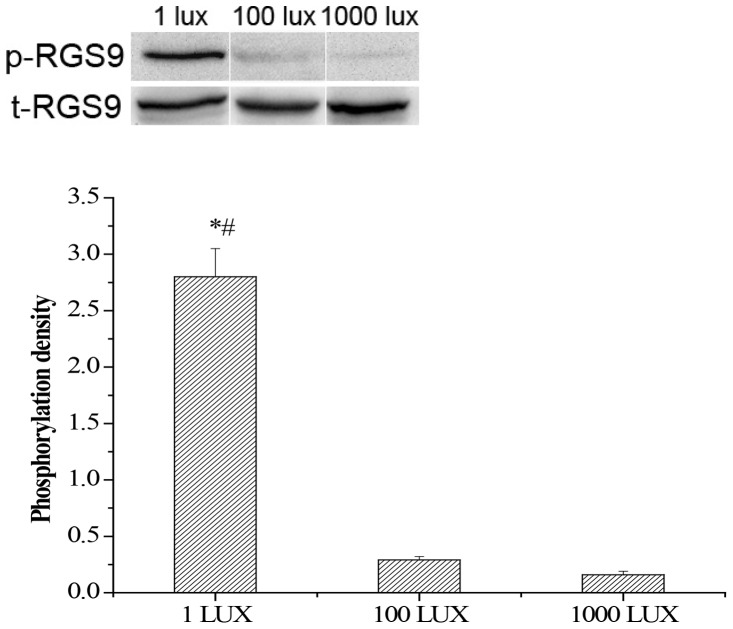
The transducin GTPase-accelerating protein complex, which determines the photoresponse duration of photoreceptors, is composed of RGS9-1, Gβ5L and R9AP. Here we report that RGS9-1 and Gβ5L change their distribution in rods during light/dark adaptation. Upon prolonged dark adaptation, RGS9-1 and Gβ5L are primarily located in rod inner segments. But very dim-light exposure quickly translocates them to the outer segments. In contrast, their anchor protein R9AP remains in the outer segment at all times. In the dark, Gβ5L's interaction with R9AP decreases significantly and RGS9-1 is phosphorylated at S(475) to a significant degree. Dim light exposure leads to quick de-phosphorylation of RGS9-1. Furthermore, after prolonged dark adaptation, RGS9-1 and transducin Gα are located in different cellular compartments. These results suggest a previously unappreciated mechanism by which prolonged dark adaptation leads to increased light sensitivity in rods by dissociating RGS9-1 from R9AP and redistributing it to rod inner segments.


Conflict of interest statement

Competing Interests: The authors have declared that no competing interests exist.

Figures

Figure 1
Figure 1. RGS9 and Gβ5L show different distribution in mouse rods in light (LA) and dark adaptation (DA).
Upper panel: Immunostaining of RGS9 (A and B), Gβ5L (C and D) and R9AP (E and F) in 200 lux light adapted (A, C and E) and dark adapted (B, D and F) mouse retinas. Arrows indicate labeling of RGS9 in the rod inner segments. RPE = Retinal Epithelium Layer; PRL = Photoreceptor Layer; OS = outer segment; IS = Inner Segment; ONL = Outer Nuclear Layer; OPL = Outer Plexiform Layer; bar = 25 µm. Lower panel: Analysis of the average levels of RGS9-1, Gβ5L and R9AP in the outer segment layer (OS) and inner segment layer (IS). OSLA = outer segment in light adapted condition; ISLA = inner segment in light adapted condition; OSDA = outer segment in dark adapted condition; ISDA = inner segment in dark adapted condition; n = 8; **P<0.001 dark adaptation vs light adaptation.
Figure 2
Figure 2. Double labeling studies using anti-RGS9 and anti-rhodopsin antibodies on dark adapted mouse retina isolated and processed in complete darkness.
Upper panel: A: the DIC image of an 8-hours dark adapted mouse retinal section indicates structural integrity of rod outer segments. This retinal section was used for a double-immunostaining of RGS9 and rhodopsin (can be recognized by the shape of RPE in A, B and D). After prolonged dark adaptation, RGS9-1 (B) is located primarily in rod inner segments and rhodopsin (C), which, in normal wild type mice, is always located in rod outer segments and is not translocated by light, is located in the rod outer segments. D: Double-immunostaining (Merge) of RGS9-1 and rhodopsin in the same region. Lower panel: Analysis of the average levels of RGS9-1 and rhodopsin in the outer segment layer and inner segment layer; n = 8. Labels are the same as in Fig. 1.
Figure 3
Figure 3. Double labeling studies using anti-Gβ5L and anti-R9AP antibodies on a dark adapted mouse retina isolated and processed in complete darkness.
Upper panel: A: the DIC image of an 8-hours dark adapted mouse retinal section indicates structural integrity of rod outer segments. This retinal section was used for a double-immunostaining of Gβ5L and R9AP. This figure clearly shows that, after prolong dark adaptation; Gβ5L is located primary in rod inner segments (B) while R9AP is always located in rod outer segments (C). D: Double-immunostaining (Merge) of Gβ5L and R9AP in the same region. E: Merge of Gβ5L and R9AP under DIC image. Lower panel: Analysis of the average levels of Gβ5L and R9AP in the outer segment layer (OS) and inner segment layer (IS); n = 8. Labels are the same as in Fig. 1.
Figure 4
Figure 4. Double labeling studies using anti-RGS9 and anti-Transducin α antibodies confirm that RGS9 is translocated between rod outer segments and inner segments during light/dark adaptation.
Upper panel: AC: Double immunostaining (Merge in C) of RGS9 (A) and Transducin α (B) on a wild type mouse retina after dark adaptation (DA); DF: Double immunostaining (Merge in F) of RGS9 (D) and Transducin α (E) on a wild type mouse retina after 1 min 20 lux light exposure; GI: Double immunostaining (Merge in I) of RGS9 (G) and Transducin α (H) on a wild type mouse retina after 1 min 150 lux light exposure. Arrows indicate labeling of RGS9 in the inner segments. Arrow heads indicate non-specifically labeled blood vessels. Other labels are the same as in Fig. 1. Lower panel: Analysis of the average levels of RGS9-1 in the outer segment layer (OS) and inner segment layer (IS); n = 8. *P<0.01,**P<0.001 vs DA; #P<0.001 vs 1 Min 20Lux.
Figure 5
Figure 5. Immunostaining of RGS9-1 on an 8 hours dark adapted mouse retina exposed to 1 min of light dimmer than 1 lux.
Upper panel: There is clear RGS9-1 staining in the rod outer segment layer, though staining in inner segment layer is much stronger. Labels are the same as in Fig. 1. Lower panel: Analysis of the average levels of RGS9-1 in the outer segment layer (OS) and inner segment layer (IS); n = 8. Labels are the same as in Fig. 1.
Figure 6
Figure 6. Tangential Serial Section Immunoblotting quantitative analysis of RS9-1, Gβ5L, R9AP in mouse retina.
Upper left: Western blots of tangential serial sections of a mouse retina after dark adaptation for 8 hours followed by 500 lux light exposure for 10 min, and then processing under 500 lux light exposure. Upper right: Western blots of tangential serial sections of a mouse retina after being dark adapted for 8 hours and then isolated and processed under dim light exposure (20 lux). The sections were cut starting from the top of the outer segments, and were immunolabeled by specific antibodies against rhodopsin, RGS9-1, Gβ5L, R9AP, and synaptophysin. Rhodopsin and synaptophysin were used as markers for the locations of the outer segments and synaptic regions of the rod photoreceptors. Lower panels: Densitometric profiles of the Western blots from the upper panels in which the densities of individual bands for RGS9, Gβ5L, R9AP, rhodopsin, and synaptophysin were expressed as percentages of the total density of all bands representing each individual protein on the blot.
Figure 7
Figure 7. Immunoprecipitation studies indicate that Gβ5L and RGS9-1 are still bound together during light/dark adaptation, and the interaction between the Gβ5L-RGS9-1 complex and R9AP is significantly reduced as the intensity of light exposure is decreased.
Mouse retinas were homogenized and subjected to immunoprecipitation (IP) with an anti-Gβ5L antibody (Santa Cruz, CA). The presence of RGS9-1 and R9AP in the eluates after IP was determined by Western blotting with anti-RGS9-1 and anti-R9AP antibodies. Binding levels (lower panel) were measured by using RGS9-1 or R9AP density vs GBeta 5L density. Error bars represent SEM, n = 5. **and * indicate significantly different than 500 lux group at P<0.001 and P<0.05 levels respectively. # indicates significantly different than 10 lux group at P<0.05 level.
Figure 8
Figure 8. RGS9-1 is heavily phosphrylated on Ser475 under very dim light exposure.
Upper panel: Mouse retinas isolated under 1 lux, 100 lux and 1000 lux were analyzed by Western blotting probed with a anti-Ser475 phospho-RGS9-1 antibody (p-RGS9) and a anti-RGS9 antibody (t-RGS9). The total RGS9 (t-RGS9) is consistent under various light/dark conditions. Lower panel: Densitometric profiles of the densities of the Western blots of individual p-RGS9 bands. Densitometric scans of the autoradiographs were quantified and analyzed statistically. Error bars represent SEM, n = 5. Asterisk denotes statistically significant differences (p<0.05); # indicates significantly different than 1000 lux group at P<0.01 level.

References

    1. Burns ME, Baylor DA (2001) Activation, deactivation, and adaptation in vertebrate photoreceptor cells. Annu Rev Neurosci 24: 779–805. - PubMed
    1. Arshavsky VY, Lamb TD, Pugh EN Jr (2002) G proteins and phototransduction. Annu Rev Physiol 64: 153–187. - PubMed
    1. Chen CK (2005) The vertebrate phototransduction cascade: amplification and termination mechanisms. Rev Physiol Biochem Pharmacol 154: 101–121. - PubMed
    1. Luo DG, Xue T, Yau KW (2008) How vision begins: an odyssey. Proc Natl Acad Sci U S A 105: 9855–9862. - PMC - PubMed
    1. Burns ME, Pugh EN Jr (2010) Lessons from photoreceptors: turning off g-protein signaling in living cells. Physiology (Bethesda) 25: 72–84. - PMC - PubMed

Publication types

MeSH terms

LinkOut - more resources