

Intracranial injection of AAV expressing NEP but not IDE reduces amyloid pathology in APP+PS1 transgenic mice
- PMID: 23555730
- PMCID: PMC3610740
- DOI: 10.1371/journal.pone.0059626
Intracranial injection of AAV expressing NEP but not IDE reduces amyloid pathology in APP+PS1 transgenic mice
Abstract
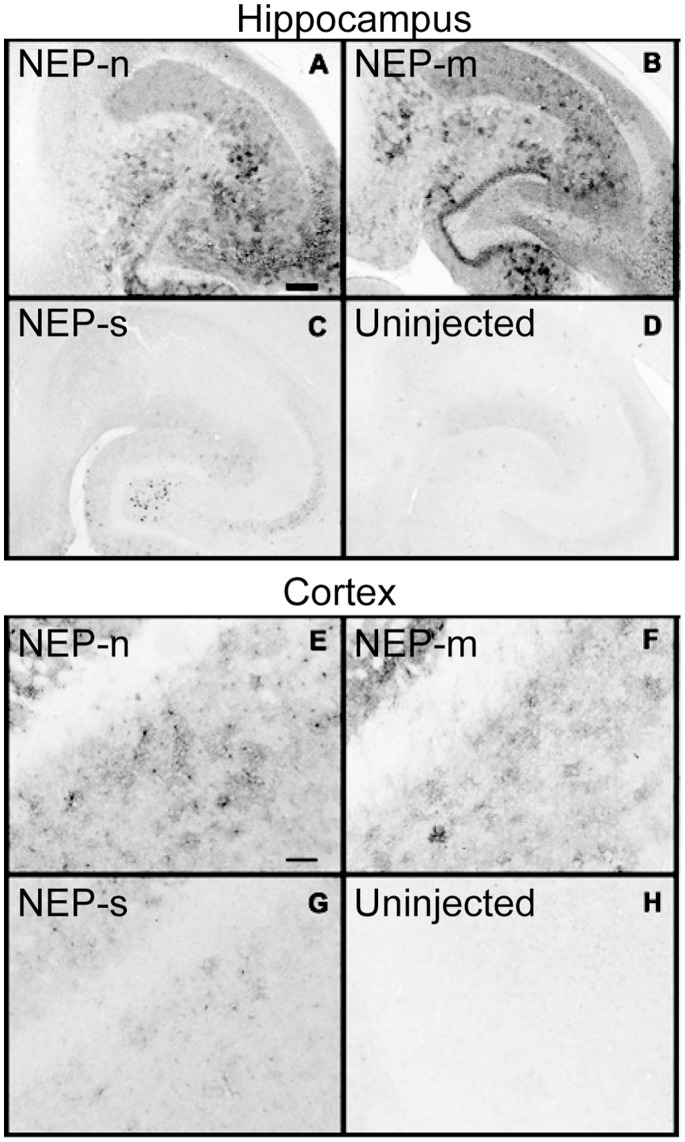
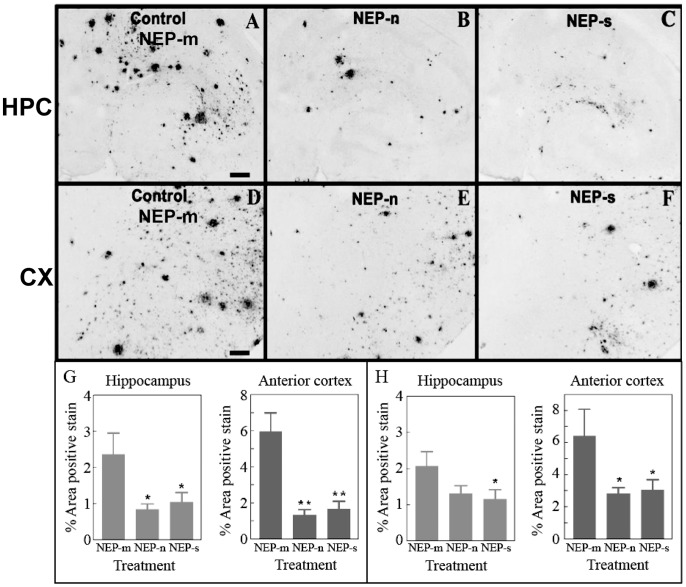
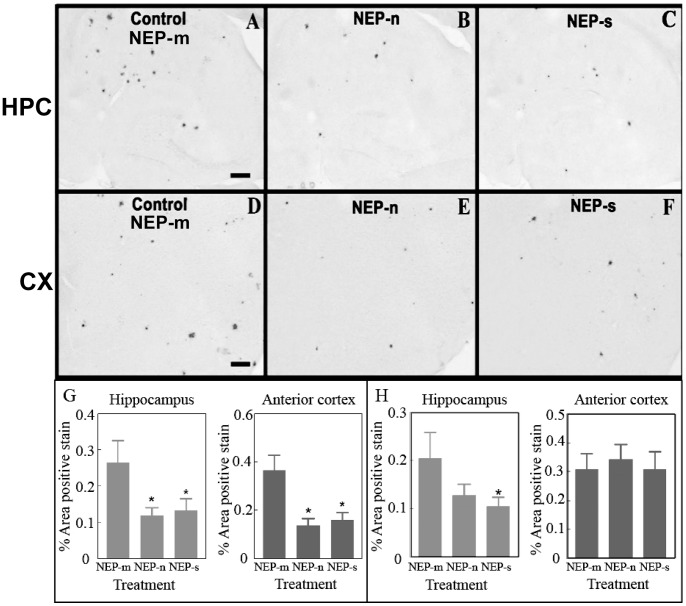
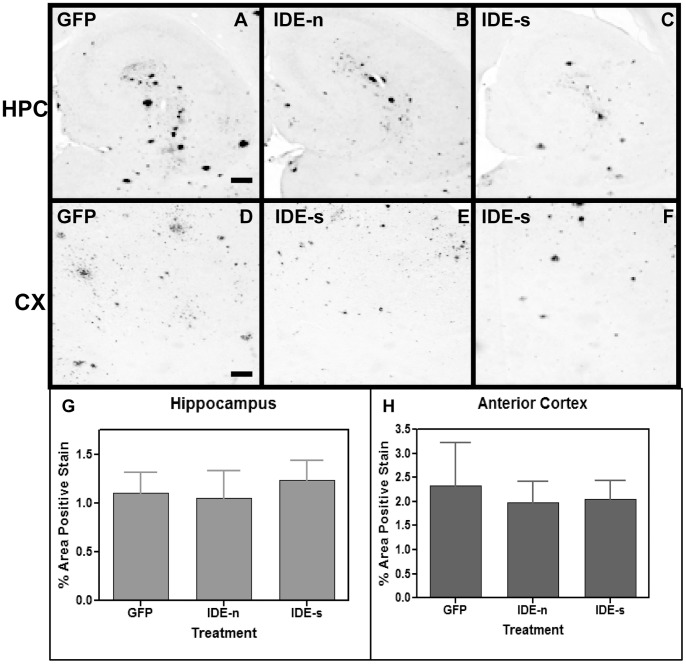
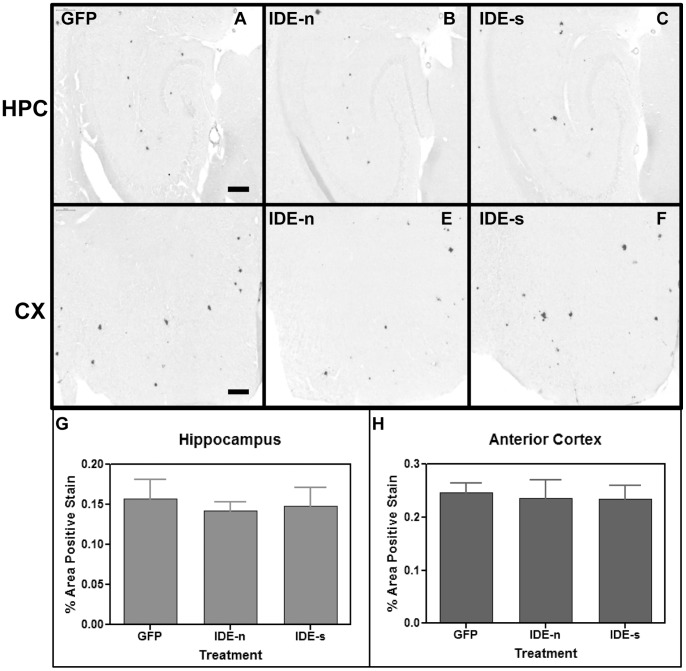
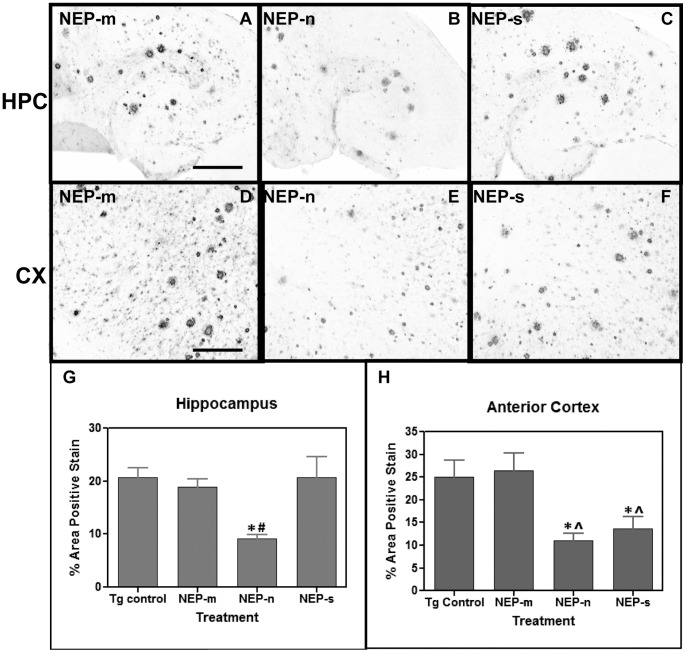
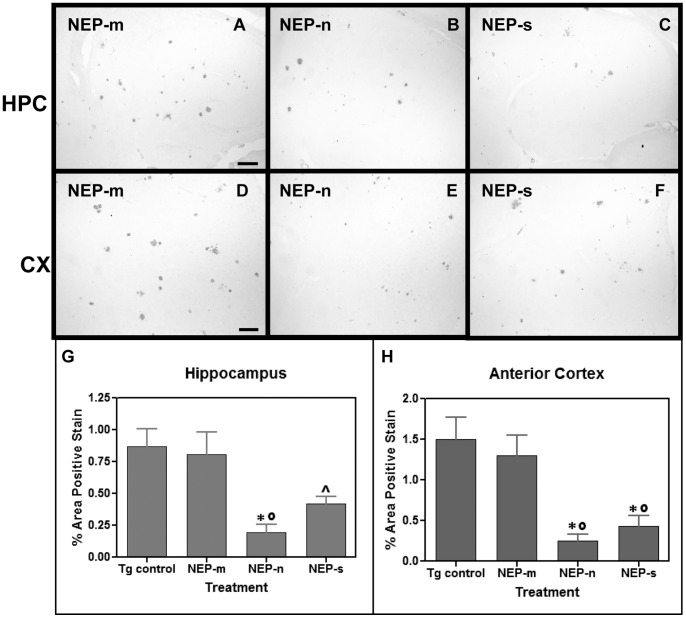
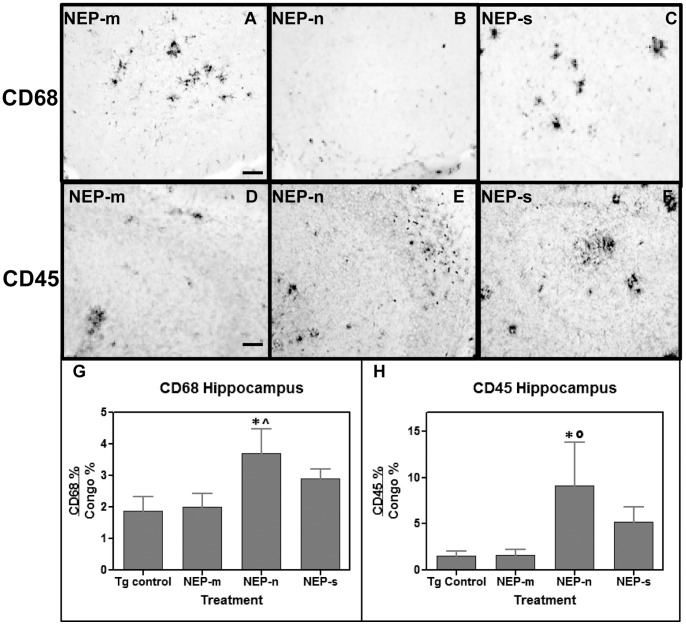
The accumulation of β-amyloid peptides in the brain has been recognized as an essential factor in Alzheimer's disease pathology. Several proteases, including Neprilysin (NEP), endothelin converting enzyme (ECE), and insulin degrading enzyme (IDE), have been shown to cleave β-amyloid peptides (Aβ). We have previously reported reductions in amyloid in APP+PS1 mice with increased expression of ECE. In this study we compared the vector-induced increased expression of NEP and IDE. We used recombinant adeno-associated viral vectors expressing either native forms of NEP (NEP-n) or IDE (IDE-n), or engineered secreted forms of NEP (NEP-s) or IDE (IDE-s). In a six-week study, immunohistochemistry staining for total Aβ was significantly decreased in animals receiving the NEP-n and NEP-s but not for IDE-n or IDE-s in either the hippocampus or cortex. Congo red staining followed a similar trend revealing significant decreases in the hippocampus and the cortex for NEP-n and NEP-s treatment groups. Our results indicate that while rAAV-IDE does not have the same therapeutic potential as rAAV-NEP, rAAV-NEP-s and NEP-n are effective at reducing amyloid loads, and both of these vectors continue to have significant effects nine months post-injection. As such, they may be considered reasonable candidates for gene therapy trials in AD.
Conflict of interest statement
Figures
Similar articles
-
GEPT extract reduces Abeta deposition by regulating the balance between production and degradation of Abeta in APPV717I transgenic mice.Curr Alzheimer Res. 2009 Apr;6(2):118-31. doi: 10.2174/156720509787602942. Curr Alzheimer Res. 2009. PMID: 19355846
-
CART modulates beta-amyloid metabolism-associated enzymes and attenuates memory deficits in APP/PS1 mice.Neurol Res. 2017 Oct;39(10):885-894. doi: 10.1080/01616412.2017.1348689. Epub 2017 Jul 25. Neurol Res. 2017. PMID: 28743230
-
CART mitigates oxidative stress and DNA damage in memory deficits of APP/PS1 mice via upregulating β‑amyloid metabolism‑associated enzymes.Mol Med Rep. 2021 Apr;23(4):280. doi: 10.3892/mmr.2021.11919. Epub 2021 Feb 19. Mol Med Rep. 2021. PMID: 33604684 Free PMC article.
-
Impact of Insulin Degrading Enzyme and Neprilysin in Alzheimer's Disease Biology: Characterization of Putative Cognates for Therapeutic Applications.J Alzheimers Dis. 2015;48(4):891-917. doi: 10.3233/JAD-150379. J Alzheimers Dis. 2015. PMID: 26444774 Review.
-
Molecular basis of selective amyloid-β degrading enzymes in Alzheimer's disease.FEBS J. 2024 Jul;291(14):2999-3029. doi: 10.1111/febs.16939. Epub 2023 Sep 8. FEBS J. 2024. PMID: 37622248 Review.
Cited by
-
Thymosin β4 reverses phenotypic polarization of glial cells and cognitive impairment via negative regulation of NF-κB signaling axis in APP/PS1 mice.J Neuroinflammation. 2021 Jun 28;18(1):146. doi: 10.1186/s12974-021-02166-3. J Neuroinflammation. 2021. PMID: 34183019 Free PMC article.
-
Neprilysin expression and functions in development, ageing and disease.Mech Ageing Dev. 2020 Dec;192:111363. doi: 10.1016/j.mad.2020.111363. Epub 2020 Sep 26. Mech Ageing Dev. 2020. PMID: 32987038 Free PMC article. Review.
-
Breast carcinoma-amplified sequence 2 regulates adult neurogenesis via β-catenin.Stem Cell Res Ther. 2022 Apr 11;13(1):160. doi: 10.1186/s13287-022-02837-9. Stem Cell Res Ther. 2022. PMID: 35410459 Free PMC article.
-
CCL2 Overexpression in the Brain Promotes Glial Activation and Accelerates Tau Pathology in a Mouse Model of Tauopathy.Front Immunol. 2020 May 20;11:997. doi: 10.3389/fimmu.2020.00997. eCollection 2020. Front Immunol. 2020. PMID: 32508844 Free PMC article.
-
Sustained Arginase 1 Expression Modulates Pathological Tau Deposits in a Mouse Model of Tauopathy.J Neurosci. 2015 Nov 4;35(44):14842-60. doi: 10.1523/JNEUROSCI.3959-14.2015. J Neurosci. 2015. PMID: 26538654 Free PMC article.
References
-
- Selkoe D (1993) Physiological production of the beta-amyloid protein and the mechanism of Alzheimer's disease. Trends in Neurosciences 16: 7. - PubMed
-
- Caccamo A, Oddo S, Sugarman MC, Akbari Y, LaFerla FM (2005) Age- and region-dependent alterations in Abeta-degrading enzymes: implications for Abeta-induced disorders. Neurobiology of aging 26: 645–654. - PubMed
-
- Pérez A, Morelli L, Cresto JC, Castaño EM (2000) Degradation of soluble amyloid beta-peptides 1–40, 1–42, and the Dutch variant 1–40Q by insulin degrading enzyme from Alzheimer disease and control brains. Neurochem Res 25: 247–255. - PubMed
Publication types
MeSH terms
Substances
Grants and funding
LinkOut - more resources
Full Text Sources
Other Literature Sources
Molecular Biology Databases
Research Materials
