. 2013;8(3):e59689.
doi: 10.1371/journal.pone.0059689. Epub 2013 Mar 26.

Impact of the 3D microenvironment on phenotype, gene expression, and EGFR inhibition of colorectal cancer cell lines

Affiliations

Impact of the 3D microenvironment on phenotype, gene expression, and EGFR inhibition of colorectal cancer cell lines

Anna C Luca et al. PLoS One. 2013.

Abstract

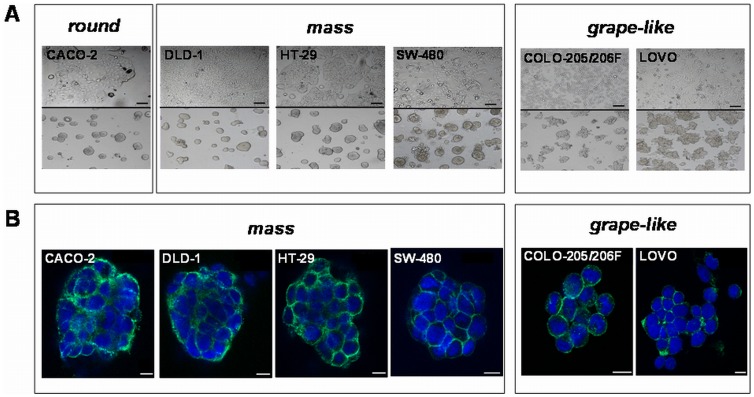
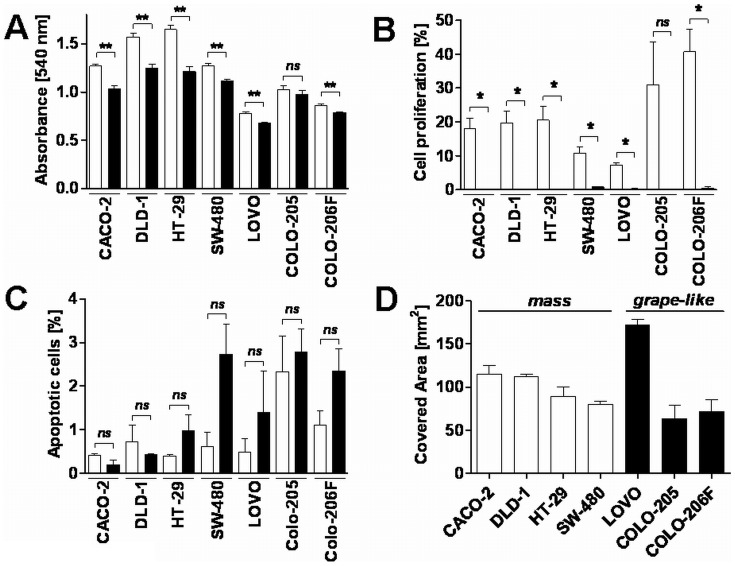
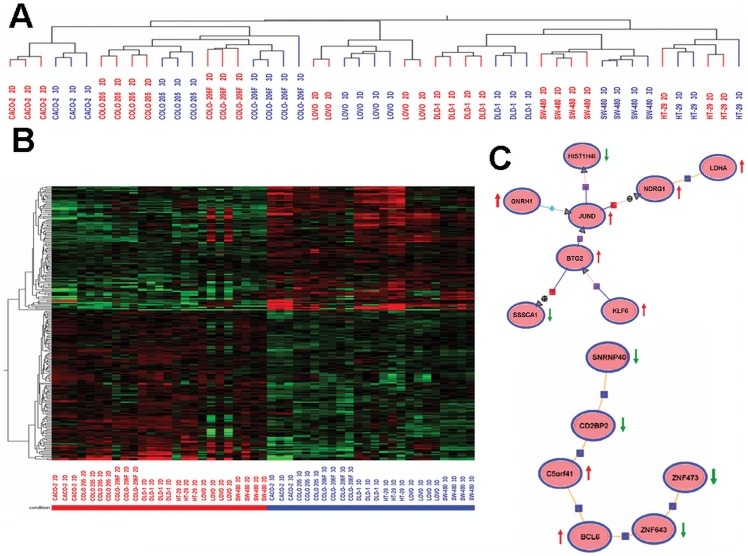
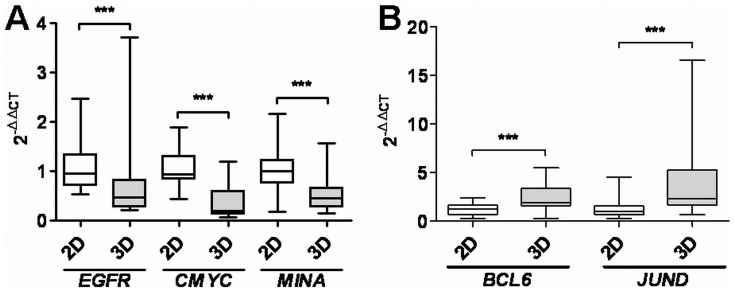
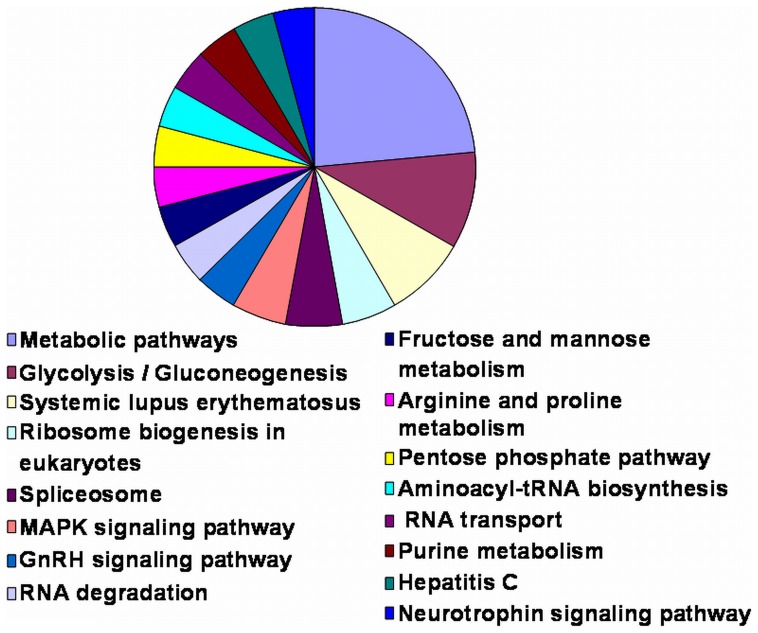
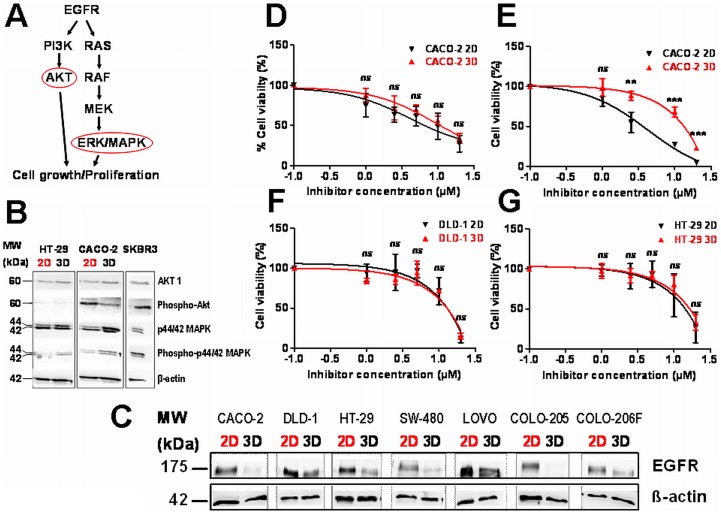
Three-dimensional (3D) tumor cell cultures grown in laminin-rich-extracellular matrix (lrECM) are considered to reflect human tumors more realistic as compared to cells grown as monolayer on plastic. Here, we systematically investigated the impact of ECM on phenotype, gene expression, EGFR signaling pathway, and on EGFR inhibition in commonly used colorectal cancer (CRC) cell lines. LrECM on-top (3D) culture assays were performed with the CRC cell lines SW-480, HT-29, DLD-1, LOVO, CACO-2, COLO-205 and COLO-206F. Morphology of lrECM cultivated CRC cell lines was determined by phase contrast and confocal laser scanning fluorescence microscopy. Proliferation of cells was examined by MTT assay, invasive capacity of the cell lines was assayed using Matrigel-coated Boyden chambers, and migratory activity was determined employing the Fence assay. Differential gene expression was analyzed at the transcriptional level by the Agilent array platform. EGFR was inhibited by using the specific small molecule inhibitor AG1478. A specific spheroid growth pattern was observed for all investigated CRC cell lines. DLD-1, HT-29 and SW-480 and CACO-2 exhibited a clear solid tumor cell formation, while LOVO, COLO-205 and COLO-206F were characterized by forming grape-like structures. Although the occurrence of a spheroid morphology did not correlate with an altered migratory, invasive, or proliferative capacity of CRC cell lines, gene expression was clearly altered in cells grown on lrECM as compared to 2D cultures. Interestingly, in KRAS wild-type cell lines, inhibition of EGFR was less effective in lrECM (3D) cultures as compared to 2D cell cultures. Thus, comparing both 2D and 3D cell culture models, our data support the influence of the ECM on cancer growth. Compared to conventional 2D cell culture, the lrECM (3D) cell culture model offers the opportunity to investigate permanent CRC cell lines under more physiological conditions, i.e. in the context of molecular therapeutic targets and their pharmacological inhibition.


Conflict of interest statement

Competing Interests: The authors have declared that no competing interests exist.

Figures

Figure 1
Figure 1. Morphology of 2D and lrECM 3D cultivated CRC cells.
A) Growth morphology of CRC cell lines cultivated under 2D (upper panel) and lrECM 3D on-top assay conditions (lower panel). Cells cultivated in 3D condition either show a round (CACO-2), mass (DLD-1, HT-29, SW-480) or a grape-like morphology (COLO 205, COLO-206F, LOVO) in phase contrast images. Scale bars: 100 µm. B) Confocal laser scanning fluorescence microscopy images of CRC spheroids. Spheroids were grown in lrECM 3D microenvironments for seven days. Subsequent to isolation, the membranous EpCAM protein (green) was stained using Alexa Fluor® 488 goat anti-mouse IgG. Nuclei were counterstained with DAPI (blue). Scale bars 10 µm.
Figure 2
Figure 2. The influence of lrECM microenvironment on cell proliferation, apoptosis and cell migration in CRC cell lines.
Cells were cultivated under 2D or 3D conditions. A) Cell viability was measured 48 h later using the MTT assay. Values represent the mean absorbance at 540 nm ± SD of triplicates. White bars represent cells cultured on plastic (2D); black bars cells cultured on lrECM (3D). Two-tailed P-values were calculated by the Mann-Whitney-U test (** indicates a P-value <0.001; ns = not significant). B) Cell proliferation was quantified by calculation of the percentage of cells with BrdU incorporation and the total number of DAPI-positive cells per field (at least three randomly selected fields per coverslip). The data presented are the mean ± SD from three replicates. White bars represent cells cultured on plastic (2D); black bars cells cultured on lrECM (3D). Two-tailed P-values were calculated by the paired t-test (* indicates a P-value <0.05; ns = not significant). C) The percentage of apoptotic cells was calculated as the ratio of DAPI-positive cells with fragmented nuclei and all DAPI-positive cells. The data presented are the mean ± SD from three replicates.White bars represent cells cultured on plastic (2D); black bars cells cultured on lrECM (3D). Two-tailed P-values were calculated by the paired t-test (ns = not significant). D) Migration of CRC cell lines was quantified using the fence assay. Data represent means ± SD of three independent experiments. White bars represent cell lines classified as mass type; black bars the grape-like class.
Figure 3
Figure 3. Differential gene expression in 2D and lrECM cultivated cells.
A) Hierarchical cluster analysis of 2D and lrECM 3D on-top cultivated CRC cells lines. A total of 23000 transcripts were clustered. Each cell line builds an independent cluster for itself. With the exception for LOVO and HT-29, within each cell line two separate clusters were observed, due to the cultivation method of the cells: 2D versus lrECM 3D on-top. B) Heatmap of 225 significantly differentially regulated genes between 2D and lrECM 3D on-top cultivated cells. (Mann-Whitney-U test, P corr <0.05). C) Literature-based network analysis of significantly differentially regulated genes (Natural Language Processor Engine, GeneSpring GX 10.5). Known interactions of 14 from a total of 225 significantly differentially regulated genes are shown. A red arrow indicates the increased expression of each gene in lrECM cultivation conditions while a green arrow indicates a reduced gene expression.
Figure 4
Figure 4. The 3D microenvironment impairs the regulation of genes involved in proliferation.
Total RNA was isolated from cells cultivated in 2D and 3D microenvironments. Quantitative RT-PCR was performed and differences in gene expression levels were calculated using the 2−ΔΔCT method. The mean fold change in expression of the target gene in 2D or 3D culture conditions was calculated using 2−ΔΔCT, where ΔΔCT = (CT Target – C GAPDH)culture condition - (CT Target - C GAPDH)2D. 2−ΔΔCT-values of all CRC cell lines (n = 7) were pooled and are presented as a box plot. A) Indicates genes being downregulated in 3D microenvironments, whereas B) shows upregulated genes. Two-tailed P-values were calculated by the Mann-Whitney-U test (*** indicates a P-value <0.0001).
Figure 5
Figure 5. KEGG pathway analysis of genes distinguishing cells grown in 2D and lrECM culture conditions.
Shown are all categories (pathways/hits) represented by three or more differently regulated genes when comparing 2D and lrECM 3D culture conditions.
Figure 6
Figure 6. Influence of culture conditions on EGFR signaling molecules and EGFR inhibition of CRC cells.
A) Schematic representation of the EGFR signalling pathway. B) Immunoblot analysis of AKT, phospho-AKT (S473), p44/42 MAPK and phospho p44/42 MAPK (Thr202/Tyr204). Equal amounts of total protein isolated from cells cultivated as 2D or lrECM 3D cultures were analyzed by SDS/PAGE/immunoblotting as indicated. β−actin served as loading control. SKBR3 served as a positive control for the expression of EGFR signaling molecules. C) Expression of the EGFR protein in 2D or lrECM (3D) cultivated CACO-2, DLD-1, HT-29, SW-480, LOVO, COLO 205 and COLO-206F cells. Cell lysate (40 µg protein per lane) was analyzed by SDS/PAGE/immunoblotting using monoclonal anti EGFR antibody. β-actin served as loading control. D–G) Treatment of 2D or lrECM cultivated CRC cells with AG1478. Two-tailed P-values were calculated by the paired t-test (** indicates a P-value <0.001; *** indicates a P-value <0.0001; ns = not significant). CACO-2 cells were treated for 48 h (D) or 96 h (E) with different concentrations of AG1478 as indicated. F–G) DLD-1 and HT-29 cells were incubated with the EGFR inhibitor AG1478 for 48 h.

Similar articles

Cited by

References

    1. Masters JR (2000) Human cancer cell lines: fact and fantasy. Nat Rev Mol Cell Biol 1: 233–236. - PubMed
    1. Kenny PA, Lee GY, Myers CA, Neve RM, Semeiks JR, et al. (2007) The morphologies of breast cancer cell lines in three-dimensional assays correlate with their profiles of gene expression. Mol Oncol 1: 84–96. - PMC - PubMed
    1. Sharma SV, Haber DA, Settleman J (2010) Cell line-based platforms to evaluate the therapeutic efficacy of candidate anticancer agents. Nat Rev Cancer 10: 241–253. - PubMed
    1. Bellis SL (2004) Variant glycosylation: an underappreciated regulatory mechanism for beta1 integrins. Biochim Biophys Acta 1663: 52–60. - PubMed
    1. Benton G, George J, Kleinman HK, Arnaoutova IP (2009) Advancing science and technology via 3D culture on basement membrane matrix. J Cell Physiol 221: 18–25. - PubMed

Publication types

MeSH terms