

Expression and functional heterogeneity of chemokine receptors CXCR4 and CXCR7 in primary patient-derived glioblastoma cells
- PMID: 23555768
- PMCID: PMC3605406
- DOI: 10.1371/journal.pone.0059750
Expression and functional heterogeneity of chemokine receptors CXCR4 and CXCR7 in primary patient-derived glioblastoma cells
Abstract
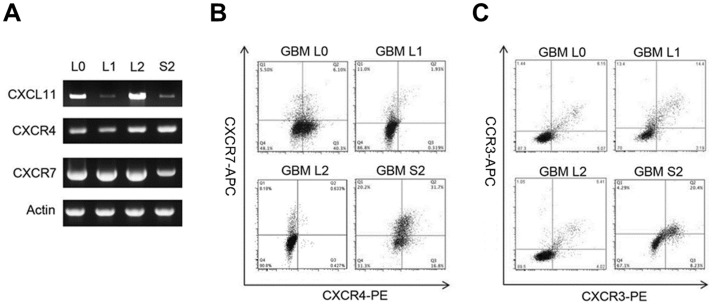
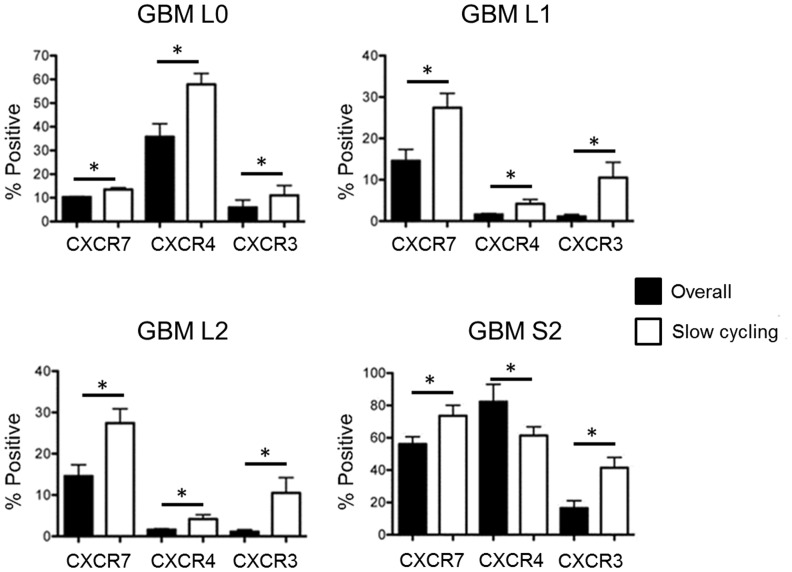
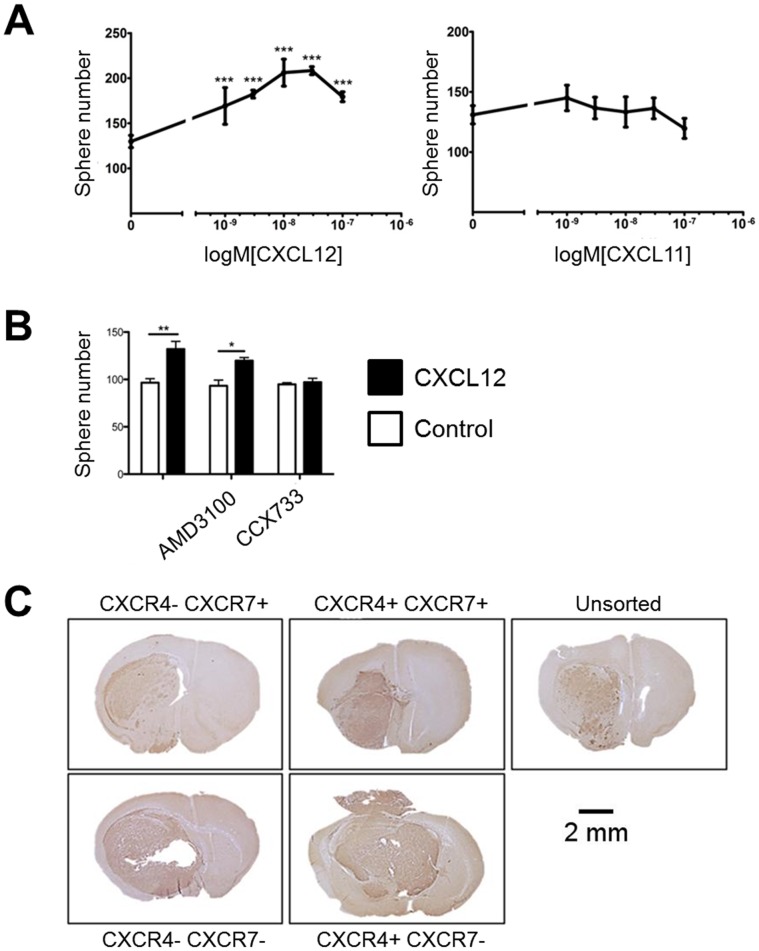
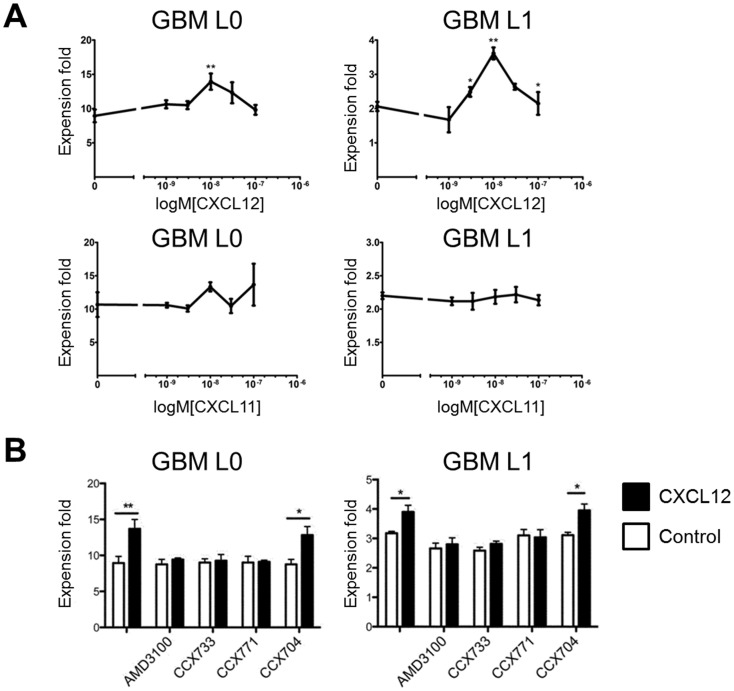
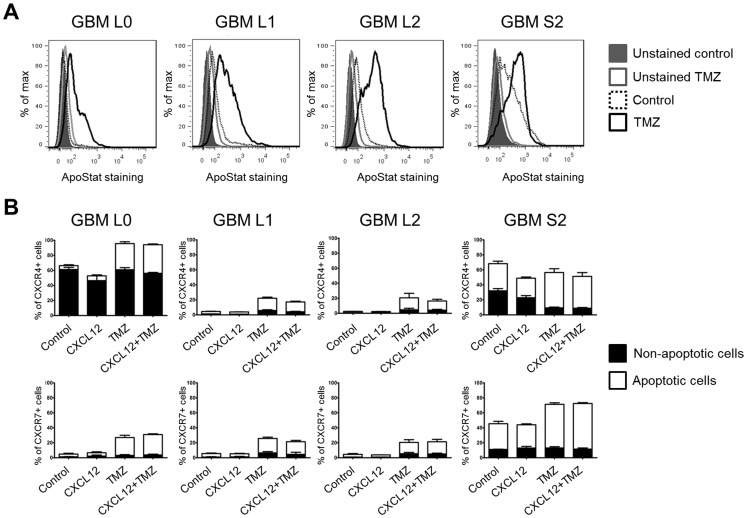
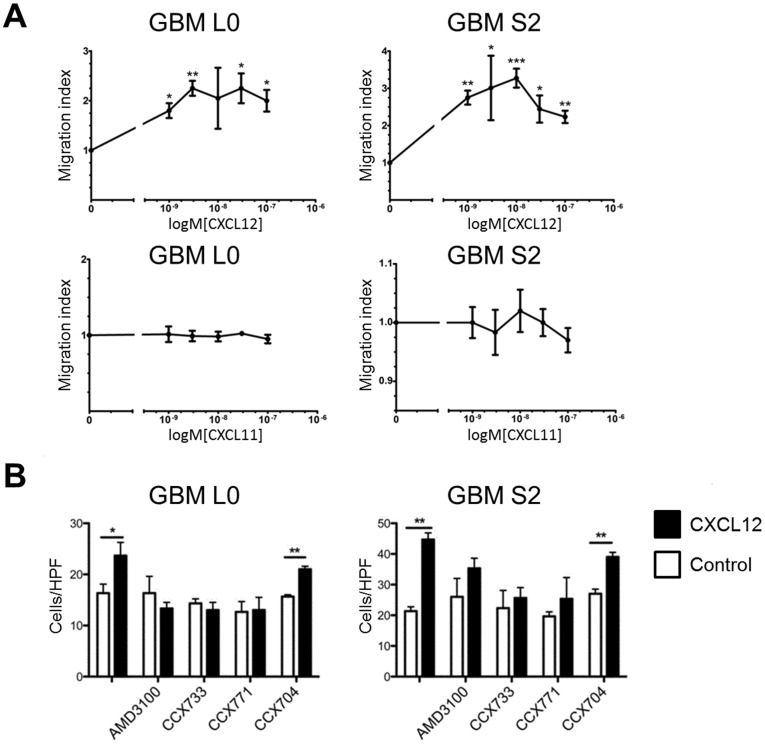
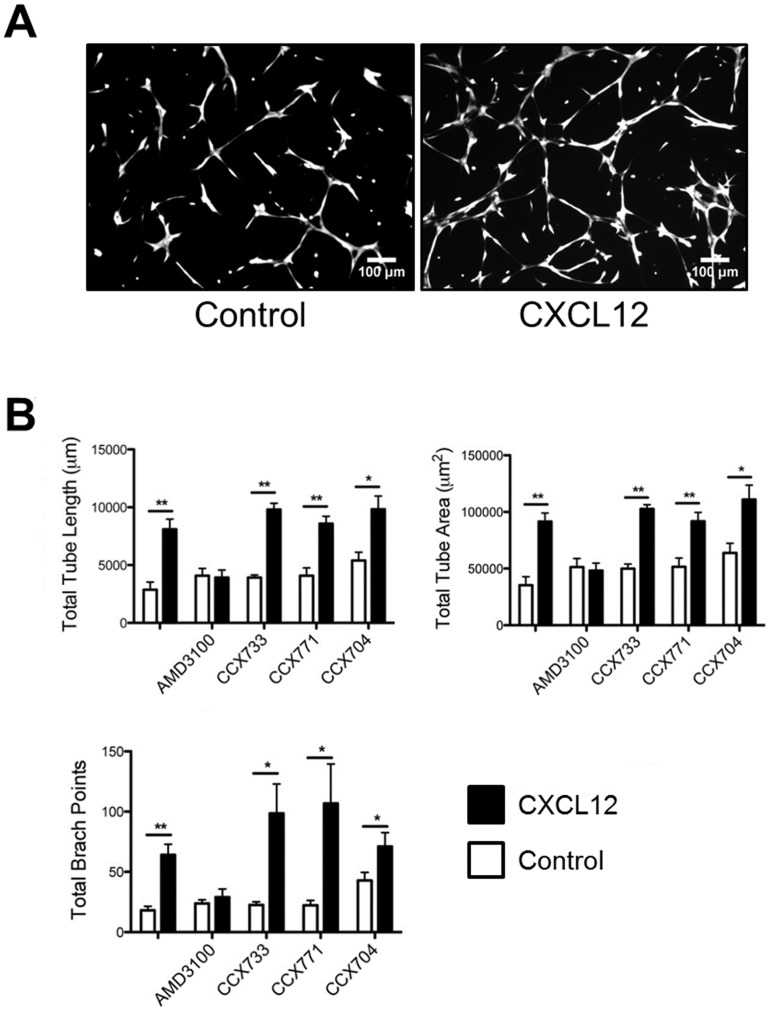
Glioblastoma (GBM) is the most common primary brain tumor in adults. The poor prognosis and minimally successful treatments of these tumors indicates a need to identify new therapeutic targets. Therapy resistance of GBMs is attributed to heterogeneity of the glioblastoma due to genetic alterations and functional subpopulations. Chemokine receptors CXCR4 and CXCR7 play important roles in progression of various cancers although the specific functions of the CXCL12-CXCR4-CXCR7 axis in GBM are less characterized. In this study we examined the expression and function of CXCR4 and CXCR7 in four primary patient-derived GBM cell lines of the proliferative subclass, investigating their roles in in vitro growth, migration, sphere and tube formation. CXCR4 and CXCR7 cell surface expression was heterogeneous both between and within each cell line examined, which was not reflected by RT-PCR analysis. Variable percentages of CXCR4+CXCR7- (CXCR4 single positive), CXCR4-CXCR7+ (CXCR7 single positive), CXCR4+CXCR7+ (double positive), and CXCR4-CXCR7- (double negative) subpopulations were evident across the lines examined. A subpopulation of slow cell cycling cells was enriched in CXCR4 and CXCR7. CXCR4+, CXCR7+, and CXCR4+/CXCR7+ subpopulations were able to initiate intracranial tumors in vivo. CXCL12 stimulated in vitro cell growth, migration, sphere formation and tube formation in some lines and, depending on the response, the effects were mediated by either CXCR4 or CXCR7. Collectively, our results indicate a high level of heterogeneity in both the surface expression and functions of CXCR4 and CXCR7 in primary human GBM cells of the proliferative subclass. Should targeting of CXCR4 and CXCR7 provide clinical benefits to GBM patients, a personalized treatment approach should be considered given the differential expression and functions of these receptors in GBM.
Conflict of interest statement
Figures
Similar articles
-
Scavenging of CXCL12 by CXCR7 promotes tumor growth and metastasis of CXCR4-positive breast cancer cells.Oncogene. 2012 Nov 8;31(45):4750-8. doi: 10.1038/onc.2011.633. Epub 2012 Jan 23. Oncogene. 2012. PMID: 22266857 Free PMC article.
-
Inflammatory CXCL12-CXCR4/CXCR7 axis mediates G-protein signaling pathway to influence the invasion and migration of nasopharyngeal carcinoma cells.Tumour Biol. 2016 Jun;37(6):8169-79. doi: 10.1007/s13277-015-4686-2. Epub 2015 Dec 29. Tumour Biol. 2016. PMID: 26715277
-
Involvement of the CXCR7/CXCR4/CXCL12 axis in the malignant progression of human neuroblastoma.PLoS One. 2012;7(8):e43665. doi: 10.1371/journal.pone.0043665. Epub 2012 Aug 20. PLoS One. 2012. PMID: 22916293 Free PMC article.
-
Tamoxifen as a modulator of CXCL12-CXCR4-CXCR7 chemokine axis: A breast cancer and glioblastoma view.Cytokine. 2023 Oct;170:156344. doi: 10.1016/j.cyto.2023.156344. Epub 2023 Aug 26. Cytokine. 2023. PMID: 37639844 Review.
-
Drug Design Targeting the CXCR4/CXCR7/CXCL12 Pathway.Curr Top Med Chem. 2016;16(13):1441-51. doi: 10.2174/1568026615666150915120218. Curr Top Med Chem. 2016. PMID: 26369824 Review.
Cited by
-
Effects of SDF-1/CXCR7 on the Migration, Invasion and Epithelial-Mesenchymal Transition of Gastric Cancer Cells.Front Genet. 2021 Nov 9;12:760048. doi: 10.3389/fgene.2021.760048. eCollection 2021. Front Genet. 2021. PMID: 34858476 Free PMC article.
-
At the Bench: Pre-clinical evidence for multiple functions of CXCR4 in cancer.J Leukoc Biol. 2021 May;109(5):969-989. doi: 10.1002/JLB.2BT1018-715RR. Epub 2020 Oct 26. J Leukoc Biol. 2021. PMID: 33104270 Free PMC article. Review.
-
MT-125 inhibits non-muscle myosin IIA and IIB and prolongs survival in glioblastoma.Cell. 2025 Aug 21;188(17):4622-4639.e19. doi: 10.1016/j.cell.2025.05.019. Epub 2025 Jun 10. Cell. 2025. PMID: 40499543
-
Tamoxifen improves cytopathic effect of oncolytic adenovirus in primary glioblastoma cells mediated through autophagy.Oncotarget. 2015 Feb 28;6(6):3977-87. doi: 10.18632/oncotarget.2897. Oncotarget. 2015. PMID: 25738357 Free PMC article.
-
Genetically Engineered T-Cells for Malignant Glioma: Overcoming the Barriers to Effective Immunotherapy.Front Immunol. 2019 Jan 22;9:3062. doi: 10.3389/fimmu.2018.03062. eCollection 2018. Front Immunol. 2019. PMID: 30740109 Free PMC article. Review.
References
-
- Mischel PS, Shai R, Shi T, Horvath S, Lu KV, et al. (2003) Identification of molecular subtypes of glioblastoma by gene expression profiling. Oncogene 22: 2361–2373. - PubMed
-
- Schulte A, Gunther HS, Phillips HS, Kemming D, Martens T, et al. (2011) A distinct subset of glioma cell lines with stem cell-like properties reflects the transcriptional phenotype of glioblastomas and overexpresses CXCR4 as therapeutic target. Glia 59: 590–602. - PubMed
-
- Phillips HS, Kharbanda S, Chen R, Forrest WF, Soriano RH, et al. (2006) Molecular subclasses of high-grade glioma predict prognosis, delineate a pattern of disease progression, and resemble stages in neurogenesis. Cancer Cell 9: 157–173. - PubMed
-
- Huse JT, Phillips HS, Brennan CW (2011) Molecular subclassification of diffuse gliomas: seeing order in the chaos. Glia 59: 1190–1199. - PubMed
Publication types
MeSH terms
Substances
Grants and funding
LinkOut - more resources
Full Text Sources
Other Literature Sources
Medical
