

Evidences of early senescence in multiple myeloma bone marrow mesenchymal stromal cells
- PMID: 23555770
- PMCID: PMC3605355
- DOI: 10.1371/journal.pone.0059756
Evidences of early senescence in multiple myeloma bone marrow mesenchymal stromal cells
Abstract
Background: In multiple myeloma, bone marrow mesenchymal stromal cells support myeloma cell growth. Previous studies have suggested that direct and indirect interactions between malignant cells and bone marrow mesenchymal stromal cells result in constitutive abnormalities in the bone marrow mesenchymal stromal cells.
Design and methods: The aims of this study were to investigate the constitutive abnormalities in myeloma bone marrow mesenchymal stromal cells and to evaluate the impact of new treatments.
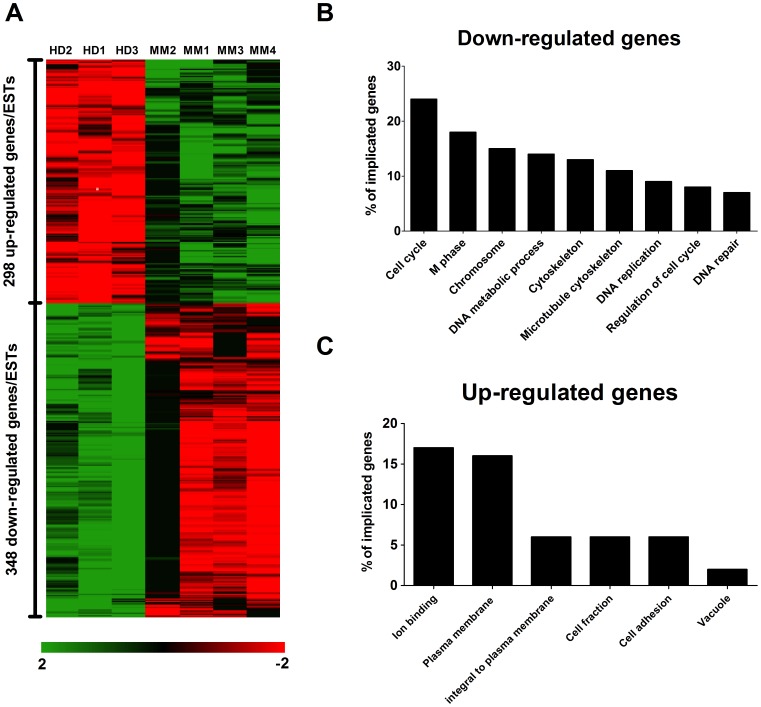
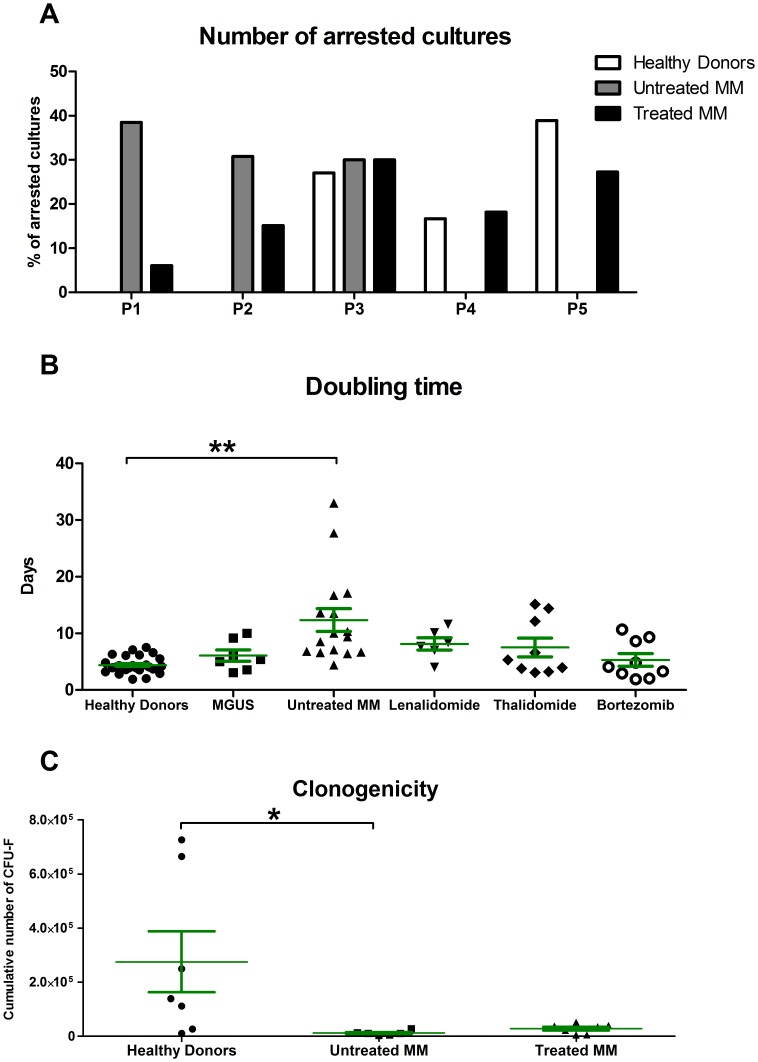
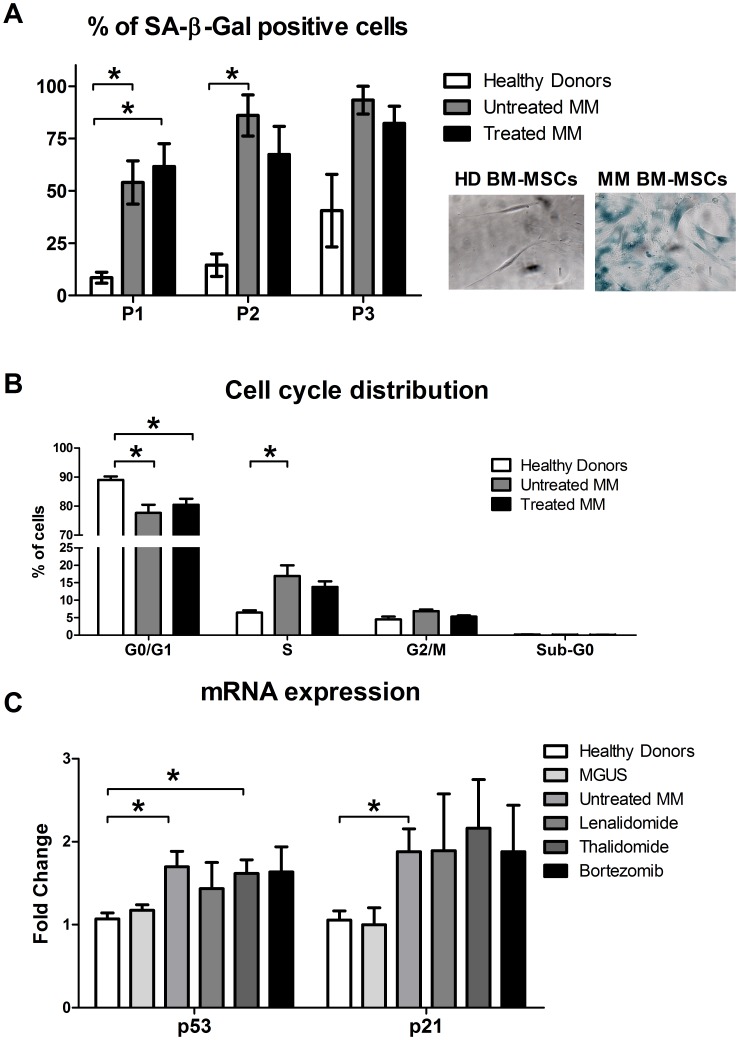
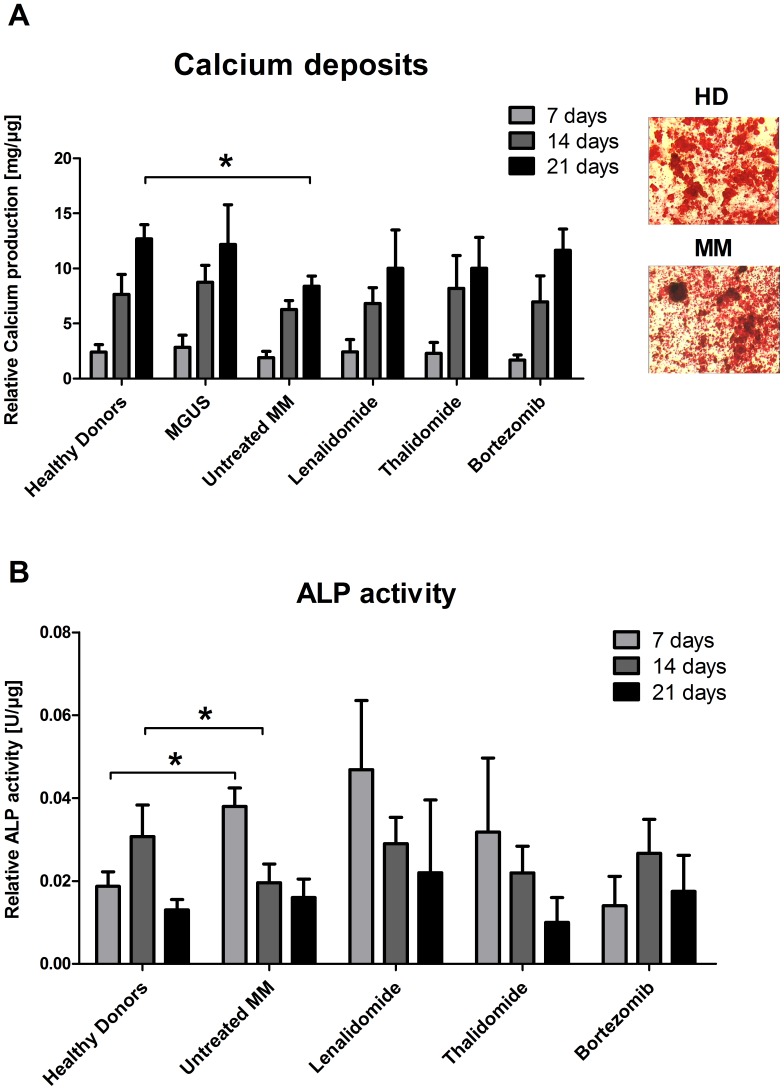
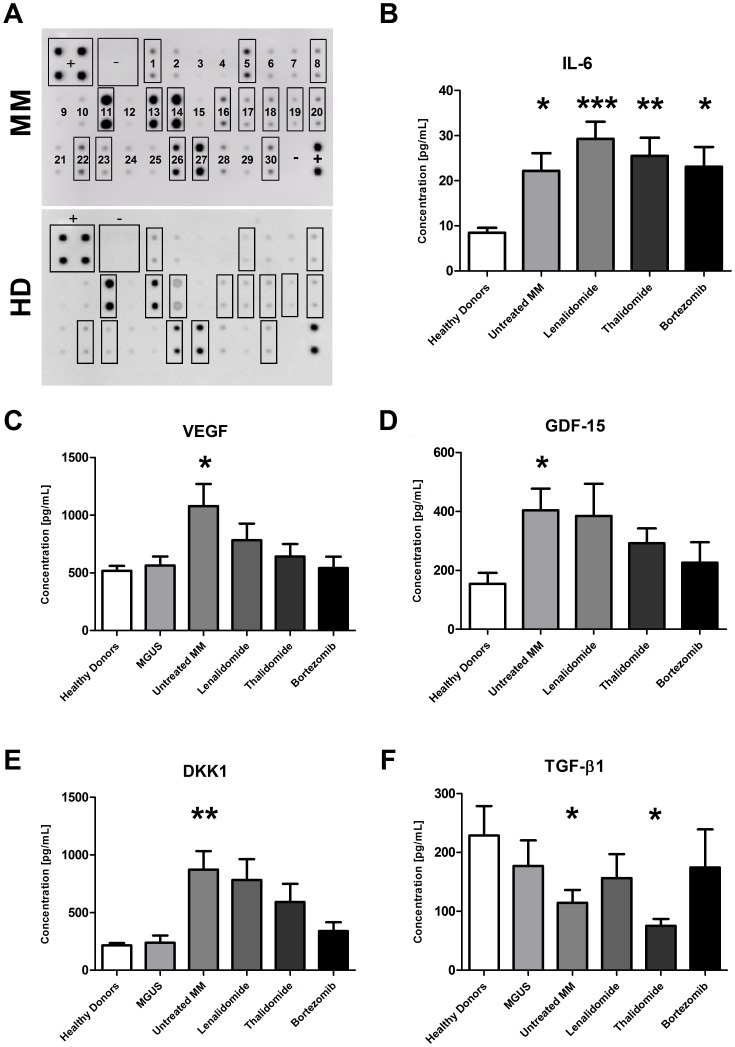
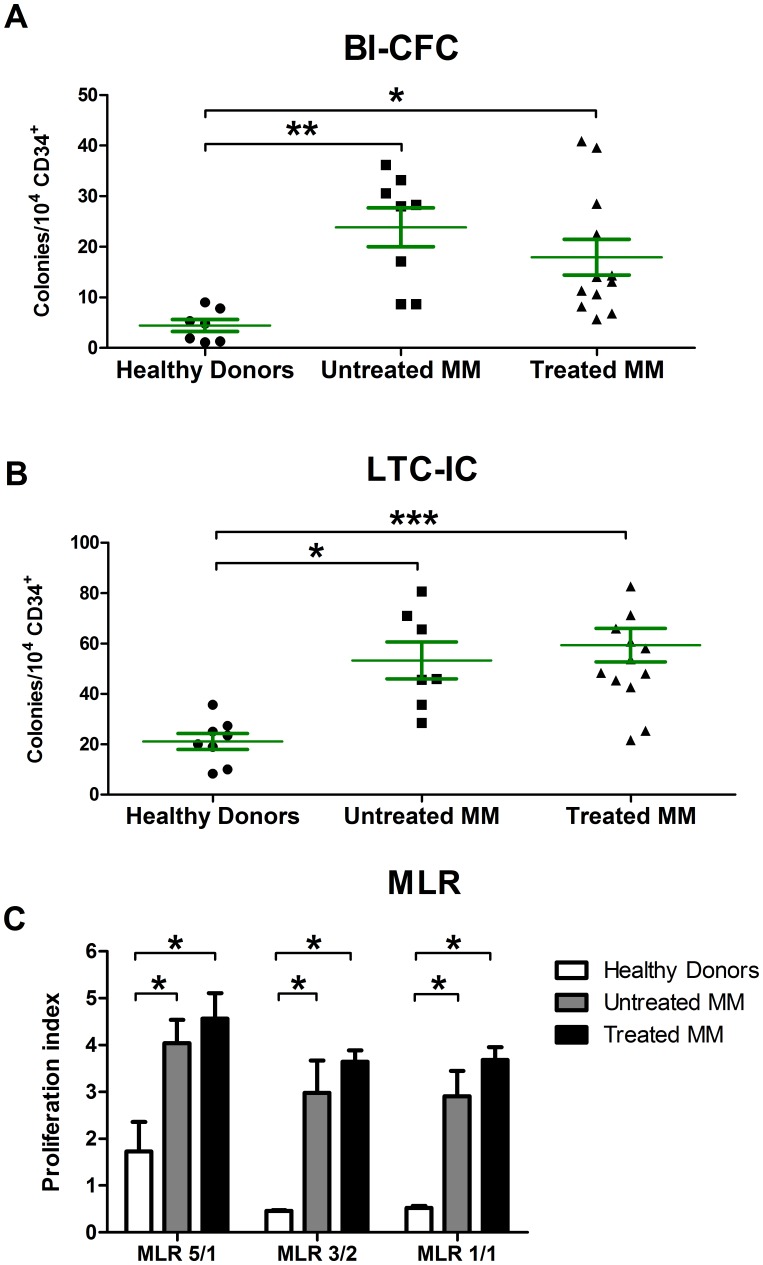
Results: We demonstrated that myeloma bone marrow mesenchymal stromal cells have an increased expression of senescence-associated β-galactosidase, increased cell size, reduced proliferation capacity and characteristic expression of senescence-associated secretory profile members. We also observed a reduction in osteoblastogenic capacity and immunomodulatory activity and an increase in hematopoietic support capacity. Finally, we determined that current treatments were able to partially reduce some abnormalities in secreted factors, proliferation and osteoblastogenesis.
Conclusions: We showed that myeloma bone marrow mesenchymal stromal cells have an early senescent profile with profound alterations in their characteristics. This senescent state most likely participates in disease progression and relapse by altering the tumor microenvironment.
Conflict of interest statement
Figures
Similar articles
-
Dicer1 downregulation by multiple myeloma cells promotes the senescence and tumor-supporting capacity and decreases the differentiation potential of mesenchymal stem cells.Cell Death Dis. 2018 May 1;9(5):512. doi: 10.1038/s41419-018-0545-6. Cell Death Dis. 2018. PMID: 29724992 Free PMC article.
-
Bone marrow mesenchymal stem cells are abnormal in multiple myeloma.Leukemia. 2007 May;21(5):1079-88. doi: 10.1038/sj.leu.2404621. Epub 2007 Mar 8. Leukemia. 2007. PMID: 17344918 Free PMC article.
-
Myeloma plasma cells alter the bone marrow microenvironment by stimulating the proliferation of mesenchymal stromal cells.Haematologica. 2014 Jan;99(1):163-71. doi: 10.3324/haematol.2013.090977. Epub 2013 Aug 9. Haematologica. 2014. PMID: 23935020 Free PMC article.
-
Bone marrow mesenchymal stem cells: historical overview and concepts.Hum Gene Ther. 2010 Sep;21(9):1045-56. doi: 10.1089/hum.2010.115. Hum Gene Ther. 2010. PMID: 20565251 Free PMC article. Review.
-
[The Latest Research Progress of Mesenchymal Stem Cells Derived from Multiple Myeloma Patients --Review].Zhongguo Shi Yan Xue Ye Xue Za Zhi. 2023 Aug;31(4):1233-1236. doi: 10.19746/j.cnki.issn.1009-2137.2023.04.047. Zhongguo Shi Yan Xue Ye Xue Za Zhi. 2023. PMID: 37551504 Review. Chinese.
Cited by
-
Mesenchymal stromal cell senescence in haematological malignancies.Cancer Metastasis Rev. 2023 Mar;42(1):277-296. doi: 10.1007/s10555-022-10069-9. Epub 2023 Jan 9. Cancer Metastasis Rev. 2023. PMID: 36622509 Review.
-
Pericentromeric satellite lncRNAs are induced in cancer-associated fibroblasts and regulate their functions in lung tumorigenesis.Cell Death Dis. 2023 Jan 12;14(1):19. doi: 10.1038/s41419-023-05553-1. Cell Death Dis. 2023. PMID: 36635266 Free PMC article.
-
PGC1α repression in IPF fibroblasts drives a pathologic metabolic, secretory and fibrogenic state.Thorax. 2019 Aug;74(8):749-760. doi: 10.1136/thoraxjnl-2019-213064. Epub 2019 Jun 10. Thorax. 2019. PMID: 31182654 Free PMC article.
-
Bone Marrow Microenvironment in Light-Chain Amyloidosis: In Vitro Expansion and Characterization of Mesenchymal Stromal Cells.Biomedicines. 2021 Oct 22;9(11):1523. doi: 10.3390/biomedicines9111523. Biomedicines. 2021. PMID: 34829752 Free PMC article.
-
Replenishing exosomes from older bone marrow stromal cells with miR-340 inhibits myeloma-related angiogenesis.Blood Adv. 2017 May 16;1(13):812-823. doi: 10.1182/bloodadvances.2016003251. eCollection 2017 May 23. Blood Adv. 2017. PMID: 29296725 Free PMC article.
References
-
- Palumbo A, Anderson K (2011) Multiple myeloma. N Engl J Med 364: 1046–1060. - PubMed
-
- Kyle RA, Rajkumar SV (2004) Multiple myeloma. N Engl J Med 351: 1860–1873. - PubMed
-
- Bataille R, Harousseau JL (1997) Multiple myeloma. N Engl J Med 336: 1657–1664. - PubMed
-
- Greipp PR, San Miguel J, Durie BGM, Crowley JJ, Barlogie B, Blade J, Boccadoro M, Child JA, Avet-Loiseau H, Kyle RA, Lahuerta JJ, Ludwig H, Morgan G, Powles R, Shimizu K, Shustik C, Sonneveld P, Tosi P, Turesson I, Westin J (2005) International staging system for multiple myeloma. J Clin Oncol 23: 3412–3420. - PubMed
Publication types
MeSH terms
Substances
LinkOut - more resources
Full Text Sources
Other Literature Sources
Medical
Molecular Biology Databases
