

T2 values of posterior horns of knee menisci in asymptomatic subjects
- PMID: 23555775
- PMCID: PMC3610938
- DOI: 10.1371/journal.pone.0059769
T2 values of posterior horns of knee menisci in asymptomatic subjects
Abstract
Purpose: The magnetic resonance (MR) T2 value of cartilage is a reliable indicator of tissue properties and therefore may be used as an objective diagnostic tool in early meniscal degeneration. The purpose of this study was to investigate age, gender, location, and zonal differences in MR T2 value of the posterior horns of knee menisci in asymptomatic subjects.
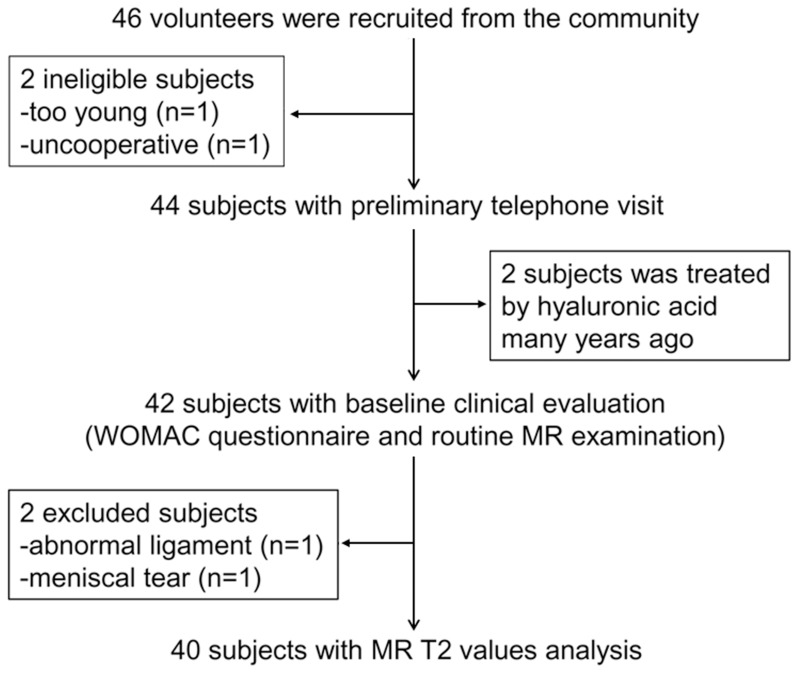
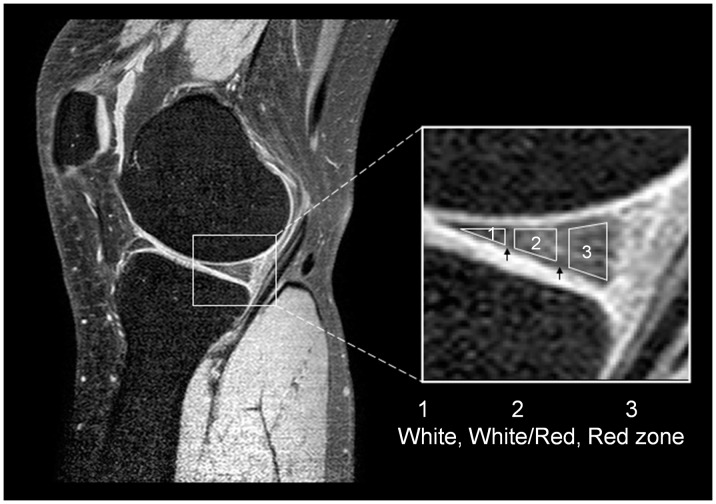
Methods: Sixty asymptomatic volunteers (30 men and 30 women) were enrolled and divided into three different age groups: 20-34, 35-49 and 50-70 years. The inclusion criteria were BMI<30 kg/cm(2), normalized Western Ontario and McMaster Universities (WOMAC) pain score of zero, and no evidence of meniscal and ligamentous abnormalities on routine knee MR imaging. The T2 values were measured on images acquired with a T2-weighted fat-suppressed turbo spin-echo sequence at 3T.
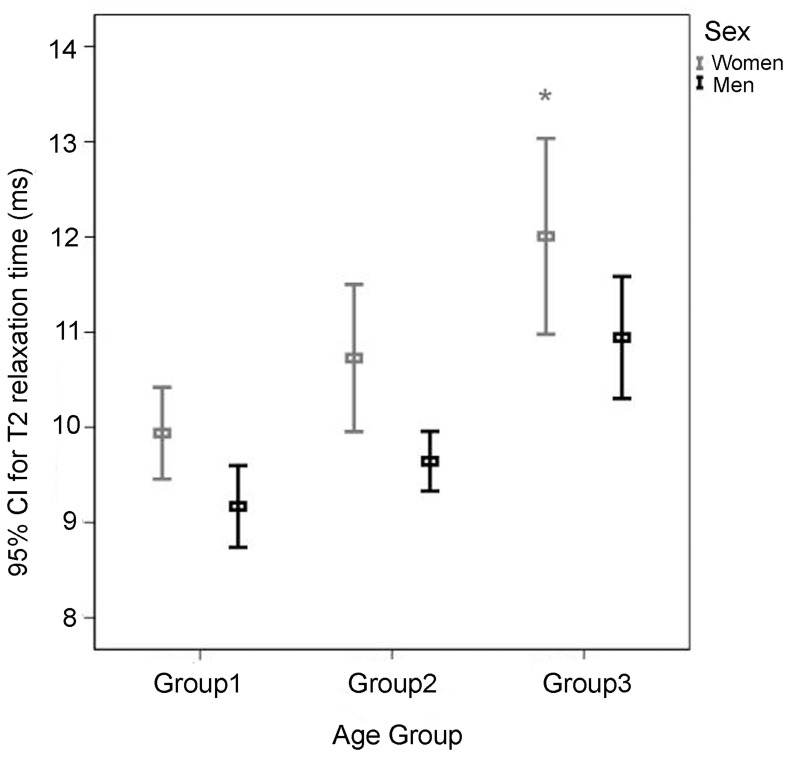
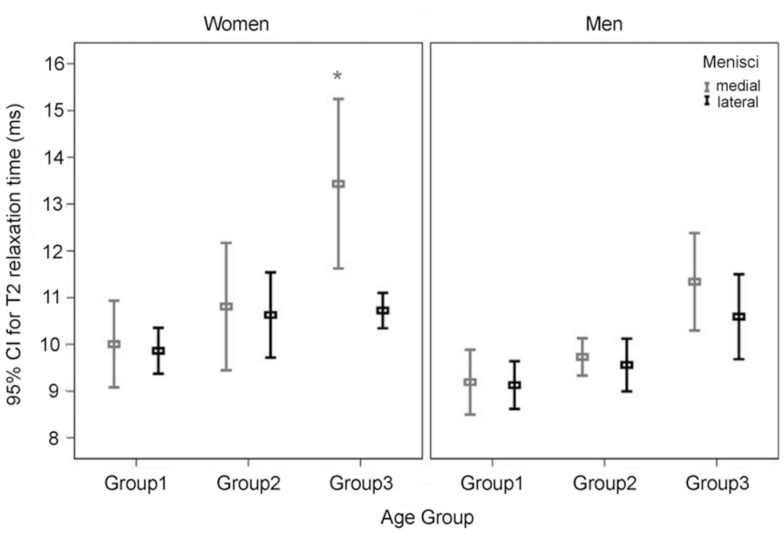
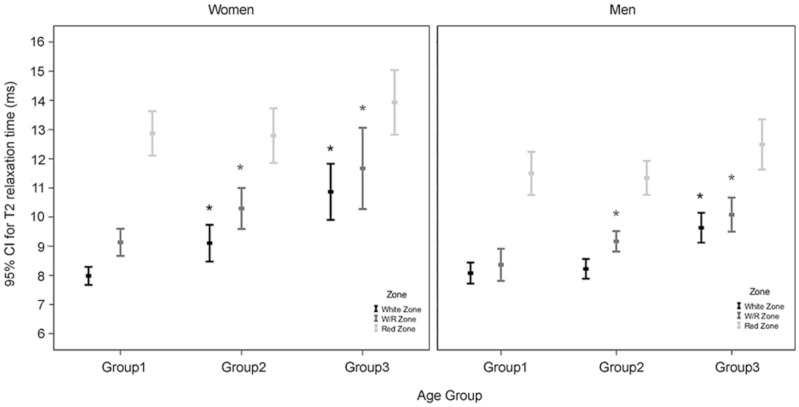
Results: The mean T2 values in both medial and lateral menisci for the 20-34, 35-49, and 50-70 age groups were 9.94 msec±0.94, 10.73 msec±1.55, and 12.36 msec±2.27, respectively, for women and 9.17 msec±0.74, 9.64 msec±0.67, and 10.95 msec±1.33, respectively, for men. The T2 values were significantly higher in the 50-70 age group than the 20-34 age group (P<0.001) and in women than in men (P = 0.001, 0.004, and 0.049 for each respective age group). T2 values were significantly higher in medial menisci than in lateral menisci only in women age 50-70 (3.33 msec, P = 0.006) and in the white zone and red/white zone of the 50-70 and 35-49 age groups than that of the 20-34 age group (2.47, 1.02; 2.77, 1.16 msec, respectively, all P<0.01).
Conclusion: The MR T2 values of the posterior meniscal horns increase with increasing age in women and are higher in women than in men. The age-related rise of T2 values appears to be more severe in medial menisci than in lateral menisci. Differences exist in the white zone and red/white zone.
Conflict of interest statement
Figures
Similar articles
-
Cartilage and meniscal T2 relaxation time as non-invasive biomarker for knee osteoarthritis and cartilage repair procedures.Osteoarthritis Cartilage. 2013 Oct;21(10):1474-84. doi: 10.1016/j.joca.2013.07.012. Epub 2013 Jul 27. Osteoarthritis Cartilage. 2013. PMID: 23896316 Free PMC article. Review.
-
MR T2 values of the knee menisci in the healthy young population: zonal and sex differences.Osteoarthritis Cartilage. 2009 Aug;17(8):988-94. doi: 10.1016/j.joca.2009.03.009. Epub 2009 Mar 24. Osteoarthritis Cartilage. 2009. PMID: 19332176
-
Rapid in vivo multicomponent T2 mapping of human knee menisci.J Magn Reson Imaging. 2015 Nov;42(5):1321-8. doi: 10.1002/jmri.24901. Epub 2015 Apr 2. J Magn Reson Imaging. 2015. PMID: 25847733 Free PMC article.
-
Meniscal measurements of T1rho and T2 at MR imaging in healthy subjects and patients with osteoarthritis.Radiology. 2008 Nov;249(2):591-600. doi: 10.1148/radiol.2492071870. Radiology. 2008. PMID: 18936315 Free PMC article.
-
Synthetic-echo time postprocessing technique for generating images with variable T2-weighted contrast: diagnosis of meniscal and cartilage abnormalities of the knee.Radiology. 2010 Jan;254(1):188-99. doi: 10.1148/radiol.2541090314. Radiology. 2010. PMID: 20032152
Cited by
-
In vivo assessment of time dependent changes of T2* in medial meniscus under loading at 3T: A preliminary study.J Appl Biomed. 2018 May 1;16(2):138-144. J Appl Biomed. 2018. PMID: 30022865 Free PMC article.
-
Maturation-Related Changes in T2 Relaxation Times of Cartilage and Meniscus of the Pediatric Knee Joint at 3 T.AJR Am J Roentgenol. 2018 Dec;211(6):1369-1375. doi: 10.2214/AJR.18.20026. Epub 2018 Oct 9. AJR Am J Roentgenol. 2018. PMID: 30299996 Free PMC article.
-
Cartilage and meniscal T2 relaxation time as non-invasive biomarker for knee osteoarthritis and cartilage repair procedures.Osteoarthritis Cartilage. 2013 Oct;21(10):1474-84. doi: 10.1016/j.joca.2013.07.012. Epub 2013 Jul 27. Osteoarthritis Cartilage. 2013. PMID: 23896316 Free PMC article. Review.
-
Are There Sex Differences in Knee Cartilage Composition and Walking Mechanics in Healthy and Osteoarthritis Populations?Clin Orthop Relat Res. 2015 Aug;473(8):2548-58. doi: 10.1007/s11999-015-4212-2. Clin Orthop Relat Res. 2015. PMID: 25716211 Free PMC article.
-
The value of MR T2* measurements in normal and osteoarthritic knee cartilage: effects of age, sex, and location.Eur Radiol. 2019 Aug;29(8):4514-4522. doi: 10.1007/s00330-018-5826-z. Epub 2019 Jan 7. Eur Radiol. 2019. PMID: 30617477
References
-
- Adams JG, McAlindon T, Dimasi M, Carey J, Eustace S (1999) Contribution of meniscal extrusion and cartilage loss to joint space narrowing in osteoarthritis. Clin Radiol 54: 502–506. - PubMed
-
- Englund M, Guermazi A, Lohmander SL (2009) The role of the meniscus in knee osteoarthritis: a cause or consequence? Radiol Clin North Am 47: 703–712. Review. - PubMed
-
- Englund M, Guermazi A, Lohmander LS (2009) The meniscus in knee osteoarthritis. Rheum Dis Clin North Am 35: 579–590. Review. - PubMed
-
- McAlindon TE, Nuite M, Krishnan N, Ruthazer R, Price LL, et al. (2011) Change in knee osteoarthritis cartilage detected by delayed gadolinium enhanced magnetic resonance imaging following treatment with collagen hydrolysate: a pilot randomized controlled trial. Osteoarthritis Cartilage 19: 399–405. - PubMed
Publication types
MeSH terms
LinkOut - more resources
Full Text Sources
Other Literature Sources
Medical
