. 2013;8(3):e59782.
doi: 10.1371/journal.pone.0059782. Epub 2013 Mar 26.

Vitiligo: a possible model of degenerative diseases

Affiliations

Vitiligo: a possible model of degenerative diseases

Barbara Bellei et al. PLoS One. 2013.

Abstract

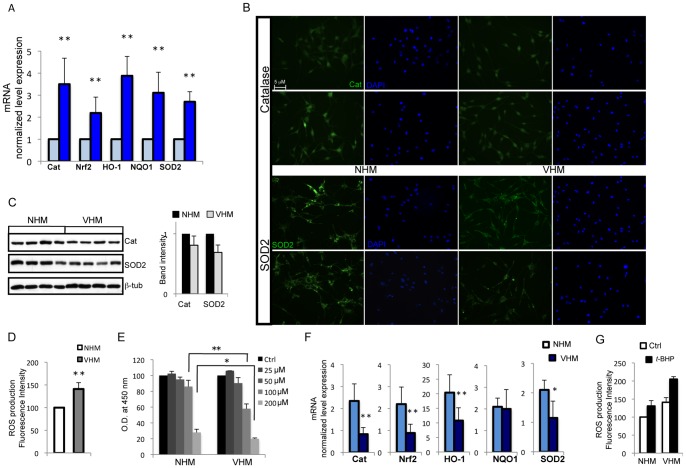
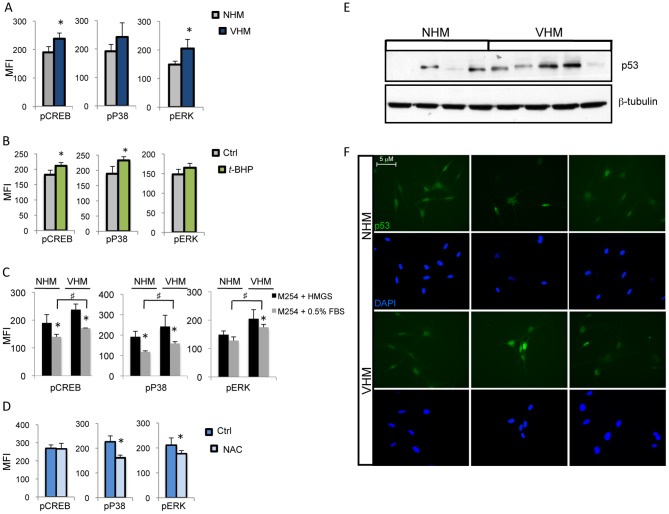
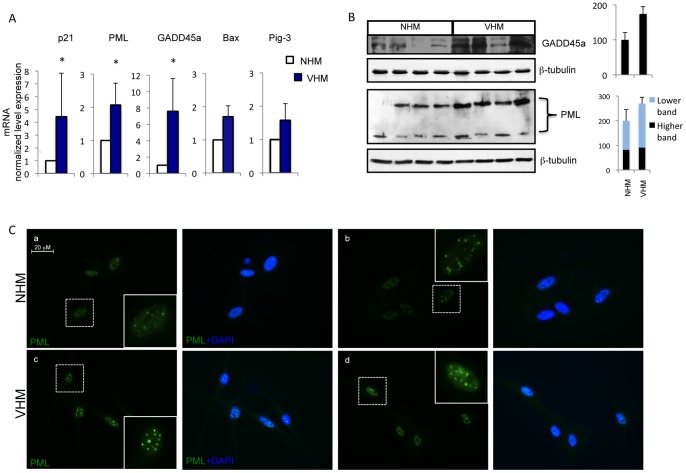
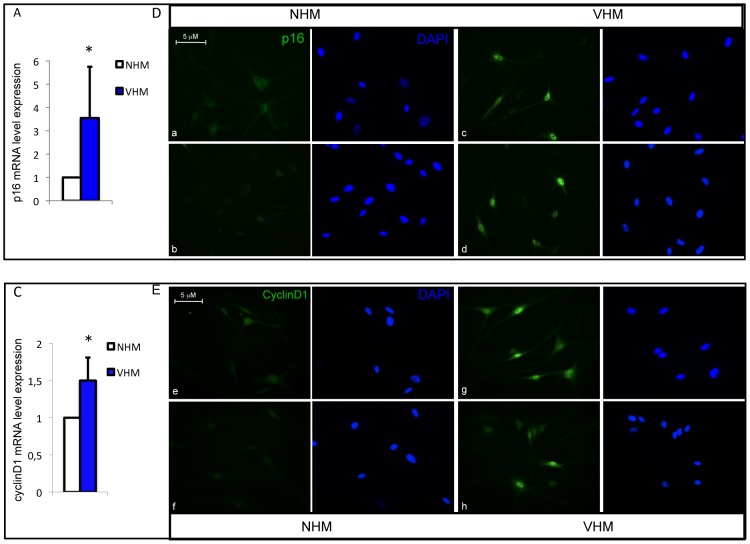
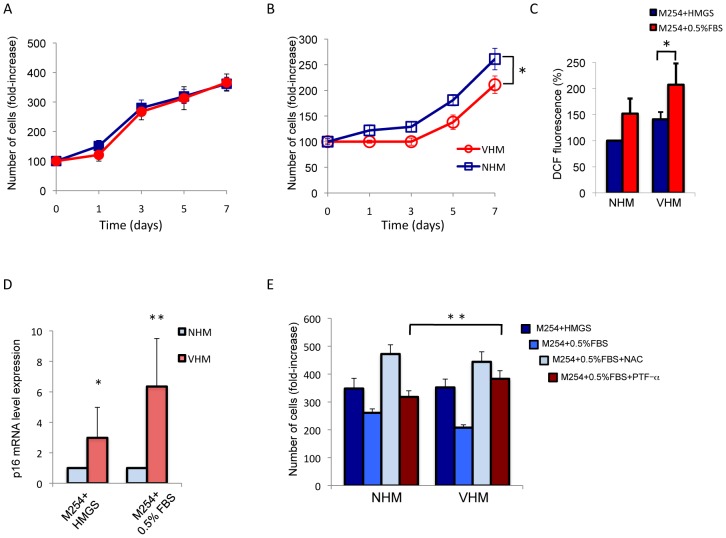
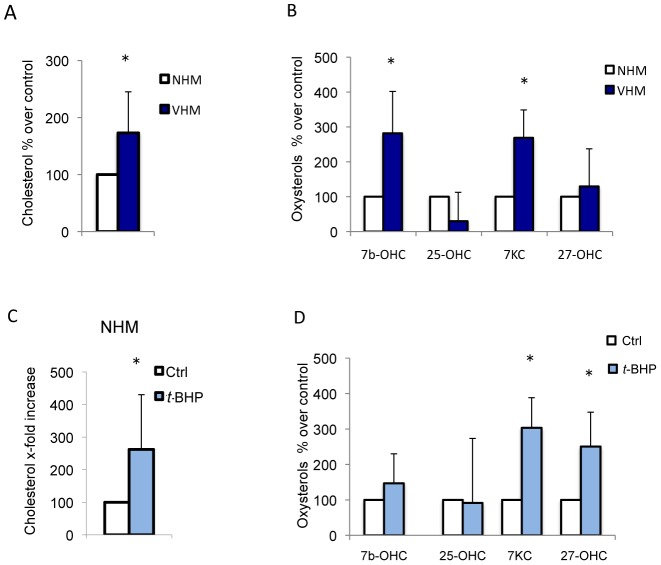
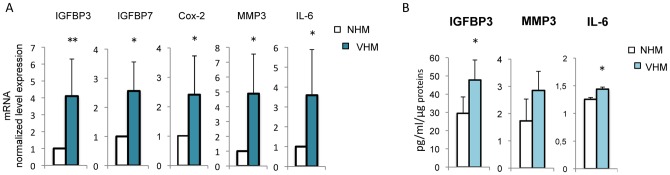
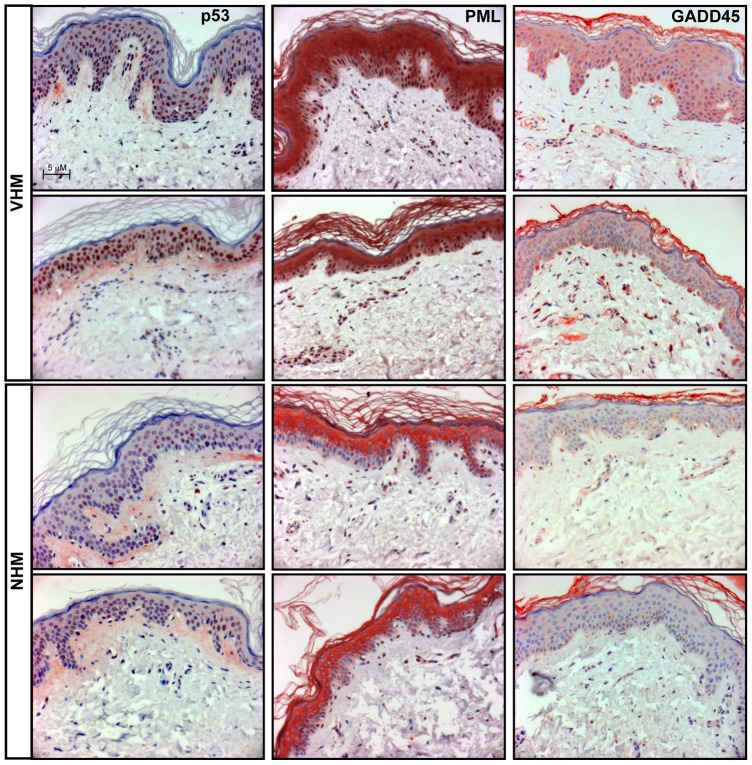
Vitiligo is characterized by the progressive disappearance of pigment cells from skin and hair follicle. Several in vitro and in vivo studies show evidence of an altered redox status, suggesting that loss of cellular redox equilibrium might be the pathogenic mechanism in vitiligo. However, despite the numerous data supporting a pathogenic role of oxidative stress, there is still no consensus explanation underlying the oxidative stress-driven disappear of melanocytes from the epidermis. In this study, in vitro characterization of melanocytes cultures from non-lesional vitiligo skin revealed at the cellular level aberrant function of signal transduction pathways common with neurodegenerative diseases including modification of lipid metabolism, hyperactivation of mitogen-activated protein kinase (MAPK) and cAMP response element-binding protein (CREB), constitutive p53-dependent stress signal transduction cascades, and enhanced sensibility to pro-apoptotic stimuli. Notably, these long-term effects of subcytotoxic oxidative stress are also biomarkers of pre-senescent cellular phenotype. Consistent with this, vitiligo cells showed a significant increase in p16 that did not correlate with the chronological age of the donor. Moreover, vitiligo melanocytes produced many biologically active proteins among the senescence-associated secretory phenotype (SAPS), such as interleukin-6 (IL-6), matrix metallo proteinase-3 (MMP3), cyclooxygenase-2 (Cox-2), insulin-like growth factor-binding protein-3 and 7 (IGFBP3, IGFBP7). Together, these data argue for a complicated pathophysiologic puzzle underlying melanocytes degeneration resembling, from the biological point of view, neurodegenerative diseases. Our results suggest new possible targets for intervention that in combination with current therapies could correct melanocytes intrinsic defects.


Conflict of interest statement

Competing Interests: The authors have declared that no competing interests exist.

Figures

Figure 1
Figure 1. Evidence for constitutive activation of cytoprotective enzymes network in vitiligo melanocyte cultures.
(A) Total RNA was extracted from eleven vitiligo and fifteen normal melanocyte cell cultures. RT-PCR analysis was performed for each sample in triplicate. The median ΔCt value, calculated as the differences between the Ct value for the gene of interest and that for the endogenous control β-actin was used to calculate 2−ΔΔCt, where ΔΔCt represents ΔCt control -ΔCt vitiligo. Values represent the means ± SD of ΔΔCt. (B) Representative immunoflrurescence reactivity of catalase (upper panel) and SOD2 (lower panel) antibodies in vitiligo (right panel) and normal melanocytes (left panel). Nuclei were labelled with bisbenzidine (DAPI). Original magnification 20x. There are no significant differences between VHM and NHM. (C) One representative western blot and denitometric analysis (NHM n = 9; VHM n = 9) of SOD2 and catalase expression. (D) Measurement of intracellular ROS production in lives cells performed by H2DCFDA method. Fluorescence intensity was measured by FACS analysis in duplicate. Data are expressed as –fold increase (VHM n = 7) over the control (NHM n = 8) and represent means ± SD. ** p≤0.01 versus control. (E) Comparative analysis of VHM (n = 8) and NHM (n = 8) sensitivity to different doses of t-BHP following 24 h treatments. After incubation period cytotoxicity was measured by MTT colorimetric assay. Values reported as O.D. decrease over untreated control represent the means ± SD of experiments performed in triplicate. (F) RT-PCR analysis of detoxifing and antioxidant genes expression. Cells were treated with 100 µM t-BHP (or not) for 24 h before RNA extraction. The ΔΔCt value was calculated as reported in (A), VHM (n = 7) and NHM (n = 7). Control values (untreated VHM and NHM) taken as 1, is omitted. The stimulation of Cat, Nrf2, HO-1 and SOD2 mRNA was significantly lower in vitiligo cells whereas NQO1 induction was similar. * p≤0.05; ** p≤0.01 versus control.
Figure 2
Figure 2. Analysis of MAPK and CREB activating phosphorylation.
(A) Comparative analysis of CREB and MAPK level of phosphorylation in VHM (n = 10) and NHM (n = 10) was performed in duplicates by FACS analysis. Histogram represents means ± SD of median fluorescence intensity MFI. (B) NHM (n = 8) demonstrated the same kinase activation profile as VHM (also compare to panel “A”) in response to treatment with t-BHP (100 µM). (C) The same immunoreactivities as in (A) were also tested following 24 h of mitogenic factors starvation (M254 medium containing 0.5% FBS) (VHM n = 8; NHM n = 8); NHM and VHM significantly decreased the level of CREB and MAPK phosphorylation. In VHM a significant much higher level of MAPK phosphorylation (compared to NHM) was retained independently to the presence of mitogenic stimulation. p≤0.05 (D) MAPK and CREB level of phosphorylation before and after treatment with NAC (5 mM) for 24 h, VHM = 6 (E) One representative western blot analysis of p53 expression. (F) Immunofluorescence staining demonstrating increased p53 nuclear localization. Representative images of VHM and NHM stained with mouse anti-p53 antibody and DAPI. Original magnification 40x. ♯ and *p≤0.05.
Figure 3
Figure 3. Analysis of p53 target genes expression.
(A) Quantitative RT-PCR analysis was performed for each sample in triplicate. The median ΔΔCt value, calculated as reported in Fig.1. Each patient sample (n = 11) was directly compared with all control samples (n = 15) and values represent the means ± SD of fold increase of p53 target genes. (B) The increased expression of GADD45a and PML were also confirmed at protein level by western blot and densitometric analysis (VHM = 9; NHM = 9). For PML two different isoforms were detected and quantified separately. (C) Representative analysis of intracellular distribution of PML by immunofluorescence analysis (VHM = 6; NHM = 6). Nuclei were labelled with bisbenzidine (DAPI). Original magnification 63x. *p≤0.05.
Figure 4
Figure 4. Analysis of cell cycle regulators expression.
(A) p16 and (B) CyclinD1 mRNAs (VHM = 11; NHM = 15). (C-D) Immunoflurescence analysis of p16 and cyclinD1 expression and localization. Representative images of VHM (right panel) and NHM (left panel) stained with mouse anti-p16 and anti-cyclinD primary antibodies. Nuclei were labelled with bisbenzidine (DAPI). Original magnification 40x. *p≤0.05.
Figure 5
Figure 5. Analysis of cell proliferation.
Cells (VHM n = 8; NHM n = 8) were incubated with M254 medium plus HMGS (A) or M254 medium plus 0.5% FBS (basal medium) (B). Growth medium was replaced with fresh medium every 48 h and cells were left to grow for 72, 96 h or a week before Trypan blue exclusion assay. The data show the mean±SD of experiments performed in triplicate. (C) Evaluation of ROS production following 24 h of growth in basal medium. (D) Analysis of mitogen deprivation (24 h) on p16 mRNA in NHM (n = 8) and VHM (n = 8). (E) To investigate the role of intracellular ROS and the specific role of stress-activated p53 on cell proliferation, starved cells were treated with 5 mM N-acetyl-L-cystein (NAC) or 5 µM pifithrin-α (PFT-α). A control sample incubated with M254 plus HMGS was also included. After 5 days the number of viable cells were evacuated by Trypan blue exclusion assay. Histograms represent –fold difference ±SD versus control (untreated cells at time 0). Experiments were performed in triplicate (NHM n = 6; VHM n = 6). *p≤0.05; **p≤0.01.
Figure 6
Figure 6. Cholesterol and oxysterols content in VHM and peroxide-treated NHM.
(A) The cholesterol and oxysterols (B) levels were measured by GC-MS analysis in VHM (n = 10) and NHM (n = 10). Histogram reports the average ± SD after normalization for protein concentration setting the NHM cholesterol content as 100. (C-D) The cholesterol and oxysterols levels of NHM treated with 100 µM t-BHP for 24 h. Results are expressed as percentage ± SD after setting the untreated cells cholesterol content as 100.
Figure 7
Figure 7. Expression of SASP components.
(A) RT-PCR analysis was performed for each sample in triplicate. Each patient sample (n = 10) was directly compared with all control samples (n = 11). (B) Enzyme-linked immunosorbent assay was used to measured intracellular IGFBP3 and IL6 and extracellular MMP3 level of production (NHM n = 8; VHM n = 8). Histogram reports the average ± SD after normalization for protein concentration. *p≤0.05.
Figure 8
Figure 8. Analysis of stress and senescent-associated markers on vitiligo tissue biopsies.
P53 and its senescent-associated target genes PML and GADD45a were analyzed on tissue biopsies (VHM = 4; NHM = 4) by immunohistochemistry.
Figure 9
Figure 9. p53 and PML expression co-localize with melanocyte specific markers.
Double immunofluoresce staining was used to co-localize the expression of the melanocyte-specific marker tyrosinase and the expression of p53 and PML. Nuclei were labelled with bisbenzidine (DAPI). Original magnification 40×.

References

    1. Taieb A, Picardo M (2009) Clinical practice: Vitiligo. N Engl J Med 360: 160–169. - PubMed
    1. Le Poole IC, Luiten RM (2008) Autoimmune etiology of generalized vitiligo. Curr Dir Autoimmun 2008 10: 227–243. - PubMed
    1. Dell'Anna ML, Ottaviani M, Albanesi V, Vidolin AP, Leone G, et al. (2007) Membrane lipid alterations as a possible basis for melanocyte dagenaration in vitiligo. J Invest Dermatol 127: 1226–1233. - PubMed
    1. Schallreuter KU, Rübsam K, Gibbons NC, Maitland DJ, Chavan B, et al. (2008) Methionine sulfoxide reductases A and B deactivated by hydrogen peroxide (H2O2) in the epidermis of patients with vitiligo. J Invest Dermatol 128: 808–815. - PubMed
    1. Gauthier Y, Cario Andre M, Taϊeb A (2003) A critical appraisal of vitiligo etiologic theories. Is melanocyte loss a melanocytorrhagy? Pigment Cell Res 16: 322–332. - PubMed

Publication types

MeSH terms