

Quantitation of hydrogen peroxide fluctuations and their modulation of dopamine dynamics in the rat dorsal striatum using fast-scan cyclic voltammetry
- PMID: 23556461
- PMCID: PMC3656754
- DOI: 10.1021/cn4000499
Quantitation of hydrogen peroxide fluctuations and their modulation of dopamine dynamics in the rat dorsal striatum using fast-scan cyclic voltammetry
Abstract
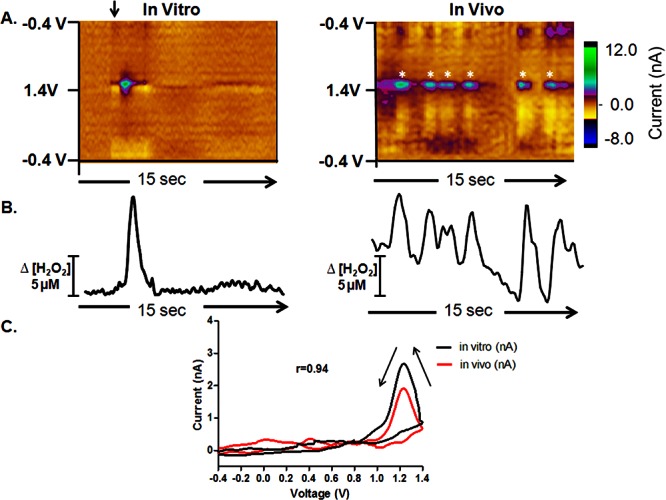
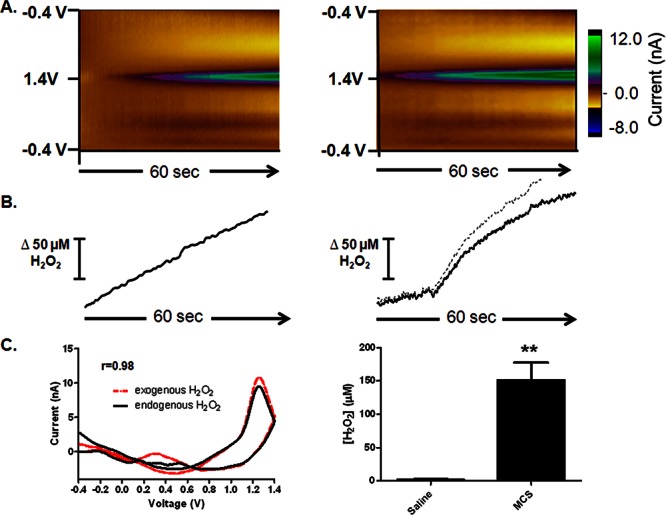
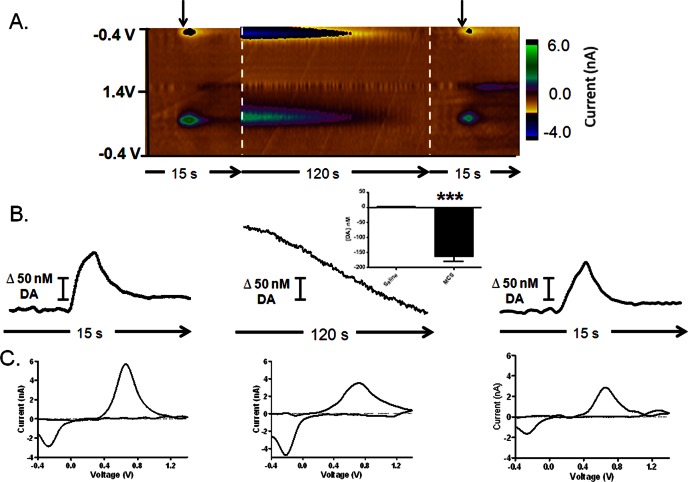
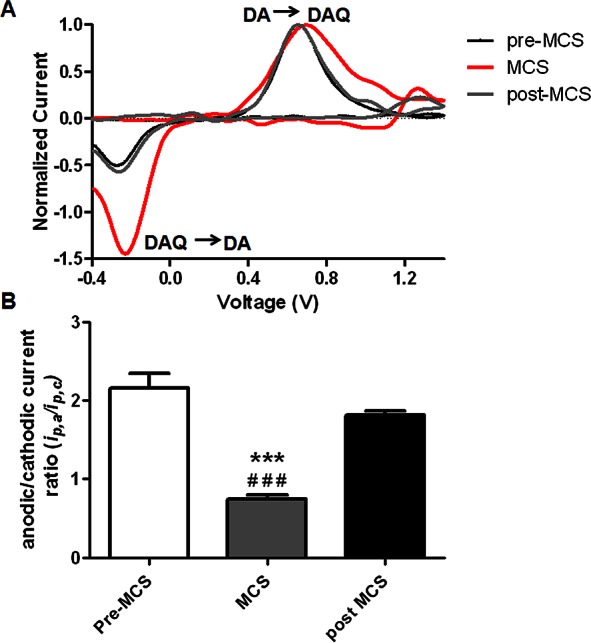
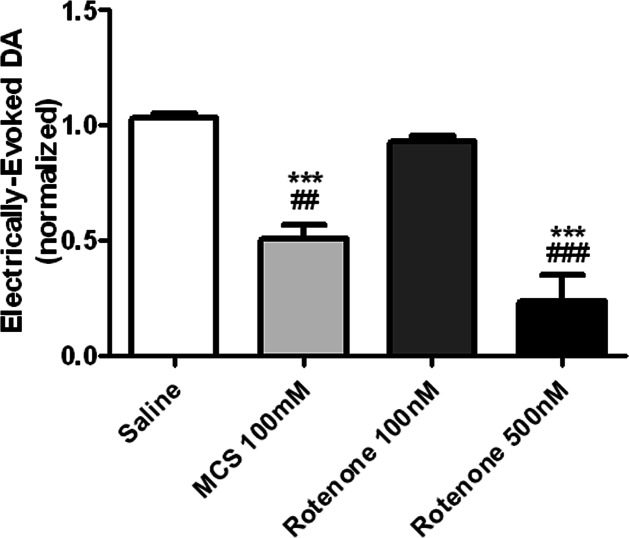
The dopaminergic neurons of the nigrostriatal dopamine (DA) projection from the substantia nigra to the dorsal striatum become dysfunctional and slowly degenerate in Parkinson's disease, a neurodegenerative disorder that afflicts more than one million Americans. There is no specific known cause for idiopathic Parkinson's disease; however, multiple lines of evidence implicate oxidative stress as an underlying factor in both the initiation and progression of the disease. This involves the enhanced generation of reactive oxygen species, including hydrogen peroxide (H2O2), whose role in complex biological processes is not well understood. Using fast-scan cyclic voltammetry at bare carbon-fiber microelectrodes, we have simultaneously monitored and quantified H2O2 and DA fluctuations in intact striatal tissue under basal conditions and in response to the initiation of oxidative stress. Furthermore, we have assessed the effect of acute increases in local H2O2 concentration on both electrically evoked DA release and basal DA levels. Increases in endogenous H2O2 in the dorsal striatum attenuated electrically evoked DA release, and also decreased basal DA levels in this brain region. These novel results will help to disambiguate the chemical mechanisms underlying the progression of neurodegenerative disease states, such as Parkinson's disease, that involve oxidative stress.
Figures
Similar articles
-
Glutamate-dependent inhibition of dopamine release in striatum is mediated by a new diffusible messenger, H2O2.J Neurosci. 2003 Apr 1;23(7):2744-50. doi: 10.1523/JNEUROSCI.23-07-02744.2003. J Neurosci. 2003. PMID: 12684460 Free PMC article.
-
Partial mitochondrial inhibition causes striatal dopamine release suppression and medium spiny neuron depolarization via H2O2 elevation, not ATP depletion.J Neurosci. 2005 Oct 26;25(43):10029-40. doi: 10.1523/JNEUROSCI.2652-05.2005. J Neurosci. 2005. PMID: 16251452 Free PMC article.
-
Modulation of somatodendritic dopamine release by endogenous H(2)O(2): susceptibility in substantia nigra but resistance in VTA.J Neurophysiol. 2002 Feb;87(2):1155-8. doi: 10.1152/jn.00629.2001. J Neurophysiol. 2002. PMID: 11826083
-
Classification of H₂O₂as a neuromodulator that regulates striatal dopamine release on a subsecond time scale.ACS Chem Neurosci. 2012 Dec 19;3(12):991-1001. doi: 10.1021/cn300130b. Epub 2012 Nov 8. ACS Chem Neurosci. 2012. PMID: 23259034 Free PMC article. Review.
-
Neurobiological model of stimulated dopamine neurotransmission to interpret fast-scan cyclic voltammetry data.Brain Res. 2015 Mar 2;1599:67-84. doi: 10.1016/j.brainres.2014.12.020. Epub 2014 Dec 16. Brain Res. 2015. PMID: 25527399 Review.
Cited by
-
Sensing Positive versus Negative Reward Signals through Adenylyl Cyclase-Coupled GPCRs in Direct and Indirect Pathway Striatal Medium Spiny Neurons.J Neurosci. 2015 Oct 14;35(41):14017-30. doi: 10.1523/JNEUROSCI.0730-15.2015. J Neurosci. 2015. PMID: 26468202 Free PMC article.
-
Measurement of Neuropeptide Y Using Aptamer-Modified Microelectrodes by Electrochemical Impedance Spectroscopy.Anal Chem. 2021 Jan 19;93(2):973-980. doi: 10.1021/acs.analchem.0c03719. Epub 2020 Dec 10. Anal Chem. 2021. PMID: 33297678 Free PMC article.
-
Novel, User-Friendly Experimental and Analysis Strategies for Fast Voltammetry: 1. The Analysis Kid for FSCV.ACS Meas Sci Au. 2021 Jun 29;1(1):11-19. doi: 10.1021/acsmeasuresciau.1c00003. eCollection 2021 Aug 18. ACS Meas Sci Au. 2021. PMID: 36785731 Free PMC article.
-
Inhibition of vascular adhesion protein 1 protects dopamine neurons from the effects of acute inflammation and restores habit learning in the striatum.J Neuroinflammation. 2021 Oct 15;18(1):233. doi: 10.1186/s12974-021-02288-8. J Neuroinflammation. 2021. PMID: 34654450 Free PMC article.
-
Electrochemical Selectivity Achieved Using a Double Voltammetric Waveform and Partial Least Squares Regression: Differentiating Endogenous Hydrogen Peroxide Fluctuations from Shifts in pH.Anal Chem. 2018 Feb 6;90(3):1767-1776. doi: 10.1021/acs.analchem.7b03717. Epub 2018 Jan 5. Anal Chem. 2018. PMID: 29243477 Free PMC article.
References
-
- Sutachan J. J.; Casas Z.; Albarracin S. L.; Stab B. R. 2nd; Samudio I.; Gonzalez J.; Morales L.; Barreto G. E. (2012) Cellular and molecular mechanisms of antioxidants in Parkinson’s disease. Nutr. Neurosci. 15, 120–126. - PubMed
-
- Sonia Angeline M.; Chaterjee P.; Anand K.; Ambasta R. K.; Kumar P. (2012) Rotenone-induced parkinsonism elicits behavioral impairments and differential expression of parkin, heat shock proteins and caspases in the rat. Neuroscience 18, 291–301. - PubMed
Publication types
MeSH terms
Substances
Grants and funding
LinkOut - more resources
Full Text Sources
Other Literature Sources
