. 2013 Apr;133(4):2314-28.
doi: 10.1121/1.4794372.

Sensitivity of bilateral cochlear implant users to fine-structure and envelope interaural time differences

Affiliations

Sensitivity of bilateral cochlear implant users to fine-structure and envelope interaural time differences

Victor A Noel et al. J Acoust Soc Am. 2013 Apr.

Abstract

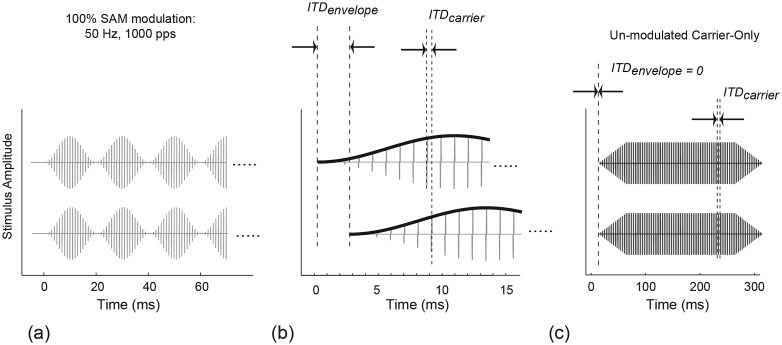
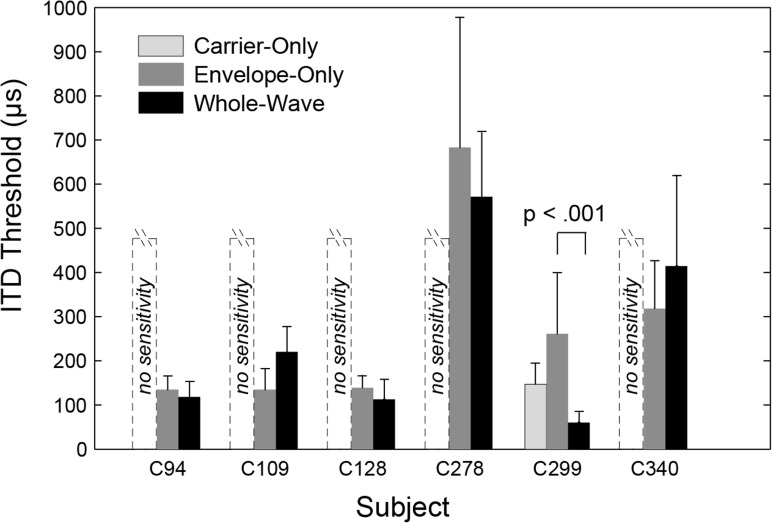
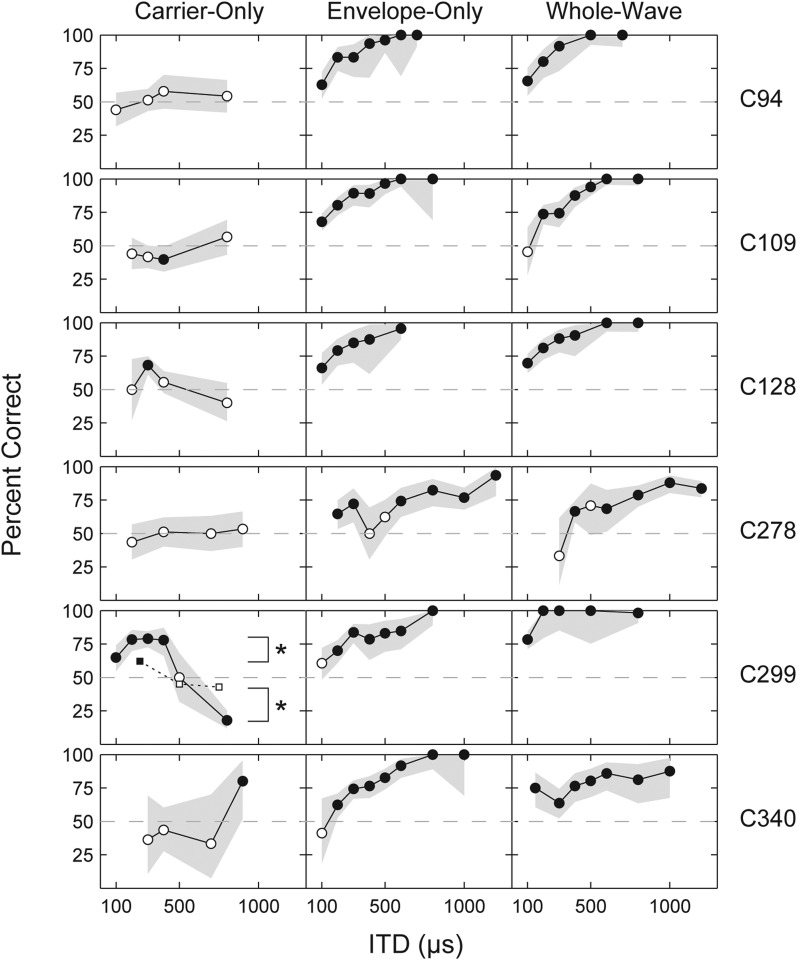
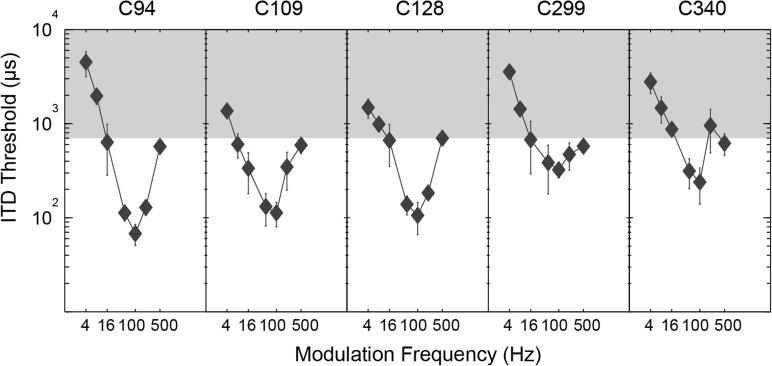
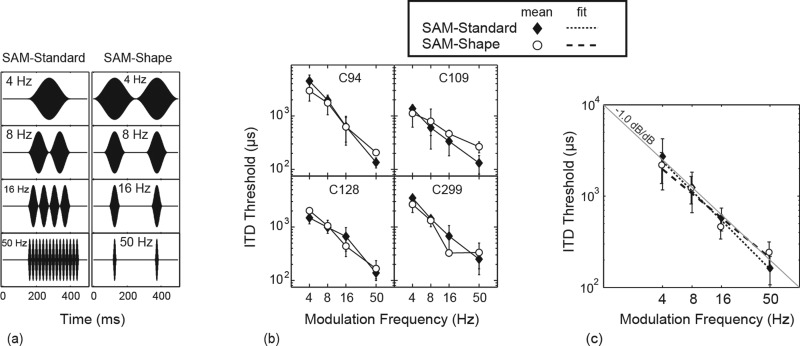
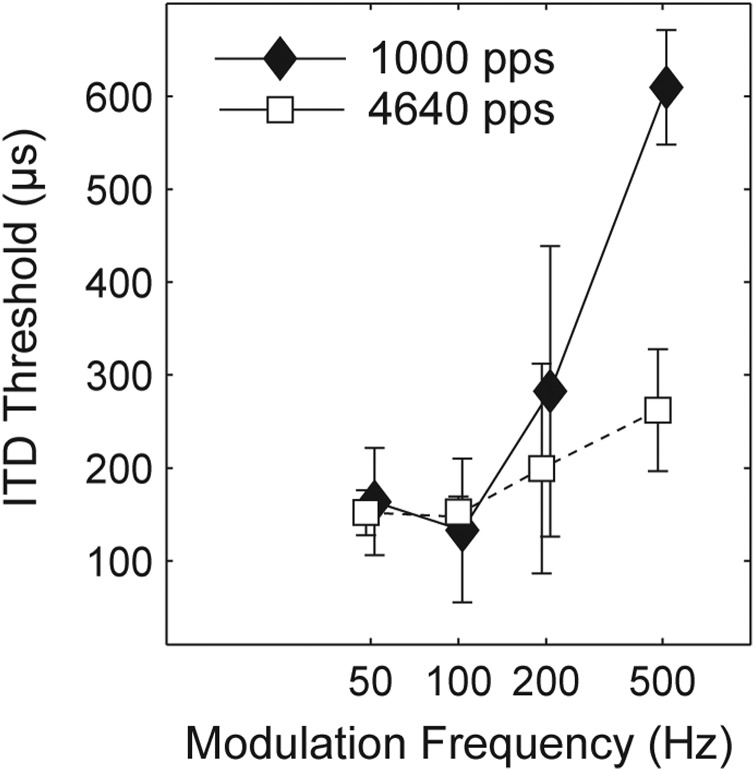
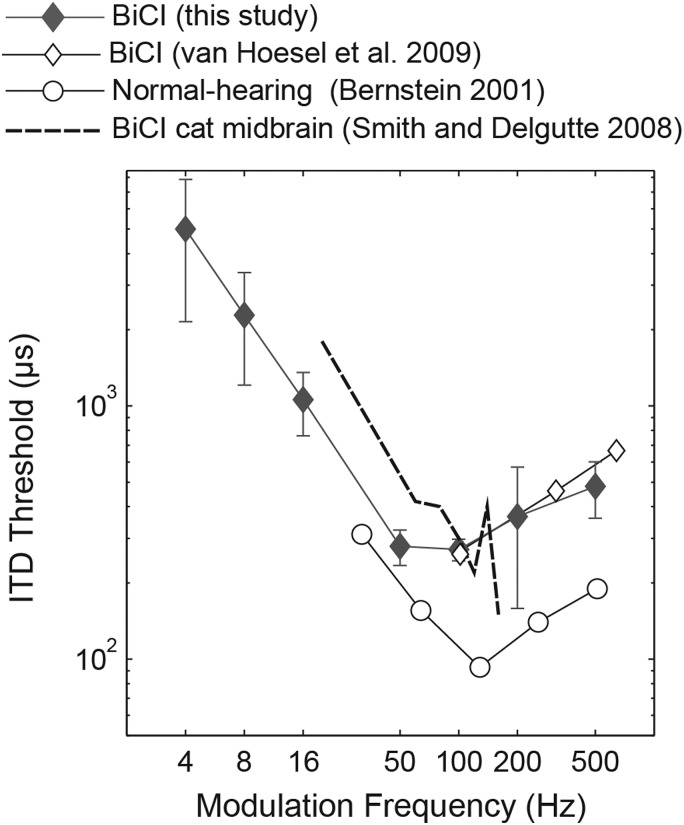
Bilateral cochlear implant users have poor sensitivity to interaural time differences (ITDs) of high-rate pulse trains, which precludes use of these stimuli to convey fine-structure ITD cues. However, previous reports of single-neuron recordings in cats demonstrated good ITD sensitivity to 1000 pulses-per-second (pps) pulses when the pulses were sinusoidally amplitude modulated. The ability of modulation to restore ITD sensitivity to high-rate pulses in humans was tested by measuring ITD thresholds for three conditions: ITD encoded in the modulated carrier pulses alone, in the envelope alone, and in the whole waveform. Five of six subjects were not sensitive to ITD in the 1000-pps carrier, even with modulation. One subject's 1000-pps carrier ITD sensitivity did significantly improve due to modulation. Sensitivity to ITD encoded in the envelope was also measured as a function of modulation frequency, including at frequencies from 4 to 16 Hz where much of the speech envelope's energy and information resides. Sensitivity was best at the modulation frequency of 100 Hz and degraded rapidly outside of a narrow range. These results provide little evidence to support encoding ITD in the carrier of current bilateral processors, and suggest envelope ITD sensitivity is poor for an important segment of the speech modulation spectrum.


Figures

Figure 1
Figure 1
Schematic illustrations of the stimuli used in Experiment 1. (a) Raised cosine, 100% modulation as generated per Eq. 1. (b) Encoding interaural time delay. In Carrier-Only coding, the envelopes in the two ears are identical and the biphasic carrier-pulses are delayed (ITDenvelope = 0). In Envelope-Only coding, the pulses are coincident in time and only their amplitude modulation is delayed (ITDcarrier = 0). Whole-Wave encoding delays the entire lagging waveform. It is the only condition in which the envelope and the carrier ITD agree, provided the ITD does not exceed one-half the carrier period. (c) Subjects who showed sensitivity to the modulated Carrier-Only waveform were also tested with the un-modulated Carrier-Only condition. In this condition envelopes have constant amplitude, except for 50-ms onset and offset ramps. The envelope ITD = 0; ITD is encoded only in the carrier pulses.
Figure 2
Figure 2
Individual subject ITD thresholds for three methods of ITD encoding. Dashed, unfilled bars labeled “no sensitivity” signify that a subject was not able to complete any adaptive test for Carrier-Only encoding, which is the case for all subjects except C299. The height of these unfilled bars serves as a reminder that given the ITD magnitude constraint for the Carrier-Only condition, only ITD thresholds below 450 μs were detectable. Error bars are standard deviations of multiple test runs. C299 alone showed a significant difference (after post hoc correction) between thresholds for the Envelope-Only and Whole-Wave conditions.
Figure 3
Figure 3
Psychometric functions for six subjects measured using each of three ITD encoding methods. Horizontal dashed lines in each panel indicate chance performance (50% correct). Filled circles represent ITD values where percent correct is significantly different than chance performance (p < 0.05). Performance at open circles is not significantly different than chance. Gray shaded regions are 95% confidence intervals. For C299 in the Carrier-Only condition, square symbols connected by a dotted line show performance when the stimulus was an un-modulated 1000-pps pulse train. In this same panel, asterisks indicate a significant improvement for modulated Carrier-Only versus un-modulated Carrier-Only conditions.
Figure 4
Figure 4
ITD threshold plotted as a function of modulation frequency for five subjects. Error bars are standard deviations for multiple runs. Shaded regions indicate ITDs greater than naturally experienced by humans.
Figure 5
Figure 5
(a) Schematic illustrations of the stimuli used in Experiment 2b. For the SAM-Standard waveform (left panels), the modulator shape and the number and repetition rate of modulator cycles vary with modulation frequency. For the SAM-Shape waveform (right panels), the modulator shape varies as for the SAM-Standard waveform, but the number and repetition rate of cycles are held constant. (b) ITD thresholds for four subjects as a function of fm for the two conditions. (c) Group means and linear regression fits of data in (b). Also plotted for reference is a thin gray line at −1.0 dB/dB slope. Correlation statistics for the fitted lines and comparisons with the reference slope are shown in Table Table II..
Figure 6
Figure 6
Mean ITD threshold (four subjects) as a function of modulation frequency, with carrier rate as a parameter. Thresholds between carrier rates only differ significantly for the modulation frequency 500 Hz. (Symbols are plotted with a small horizontal offset to enhance their visibility.)
Figure 7
Figure 7
Comparison of SAM envelope ITD sensitivity. Human BiCI thresholds from this study using a carrier of 1000 pps for fm of 4 to 16 Hz and 5000-pps for fm of 50 to 500 Hz (carriers chosen for comparison with previous studies). Additional human BiCI thresholds are from Fig. 1 in van Hoesel et al. (2009) using a 6000-pps carrier. NH human psychophysics are from Fig. 9 in Bernstein (2001) using a 4-kHz tone carrier. BiCI single-neuron data from cat IC is from Fig. 5(b) in Smith and Delgutte (2008) using a 1000-pps carrier. All thresholds are specified at a sensitivity of d′ = 1.

Similar articles

Cited by

References

    1. Bernstein, L. R. (2001). “ Auditory processing of interaural timing information: new insights,” J. Neurosci. Res. 66, 1035–1046.10.1002/jnr.10103 - DOI - PubMed
    1. Bernstein, L. R., and Trahiotis, C. (1994). “ Detection of interaural delay in high-frequency sinusoidally amplitude-modulated tones, two-tone complexes, and bands of noise,” J. Acoust. Soc. Am. 95, 3561–3567.10.1121/1.409973 - DOI - PubMed
    1. Bernstein, L. R., and Trahiotis, C. (2009). “ How sensitivity to ongoing interaural temporal disparities is affected by manipulations of temporal features of the envelopes of high-frequency stimuli,” J. Acoust. Soc. Am. 125, 3234–3242.10.1121/1.3101454 - DOI - PMC - PubMed
    1. Blauert, J. (1997). Spatial Hearing (MIT Press, Cambridge, MA: ), pp. 36–200.
    1. Bronkhorst, A. W., and Plomp, R. (1988). “ The effect of head-induced interaural time and level differences on speech intelligibility in noise,” J. Acoust. Soc. Am. 83, 1508–1516.10.1121/1.395906 - DOI - PubMed

Publication types

MeSH terms