

Prediction of human observer performance in a 2-alternative forced choice low-contrast detection task using channelized Hotelling observer: impact of radiation dose and reconstruction algorithms
- PMID: 23556902
- PMCID: PMC3618092
- DOI: 10.1118/1.4794498
Prediction of human observer performance in a 2-alternative forced choice low-contrast detection task using channelized Hotelling observer: impact of radiation dose and reconstruction algorithms
Abstract
Purpose: Efficient optimization of CT protocols demands a quantitative approach to predicting human observer performance on specific tasks at various scan and reconstruction settings. The goal of this work was to investigate how well a channelized Hotelling observer (CHO) can predict human observer performance on 2-alternative forced choice (2AFC) lesion-detection tasks at various dose levels and two different reconstruction algorithms: a filtered-backprojection (FBP) and an iterative reconstruction (IR) method.
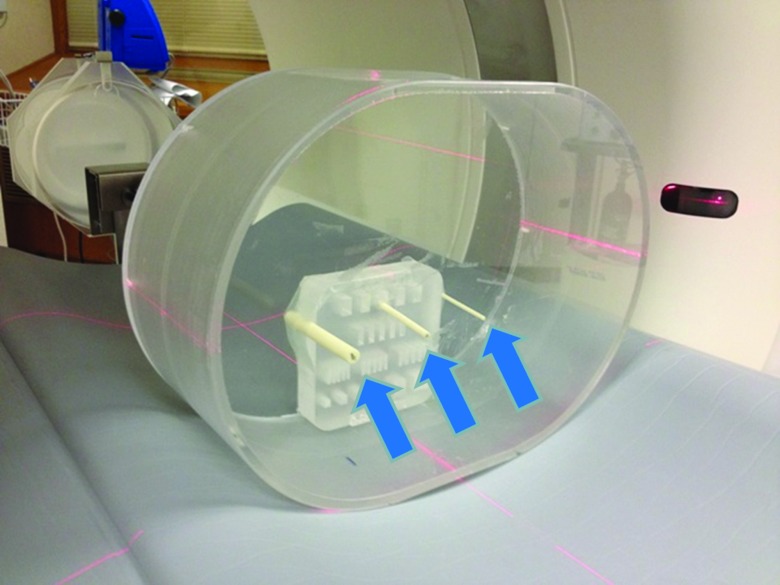
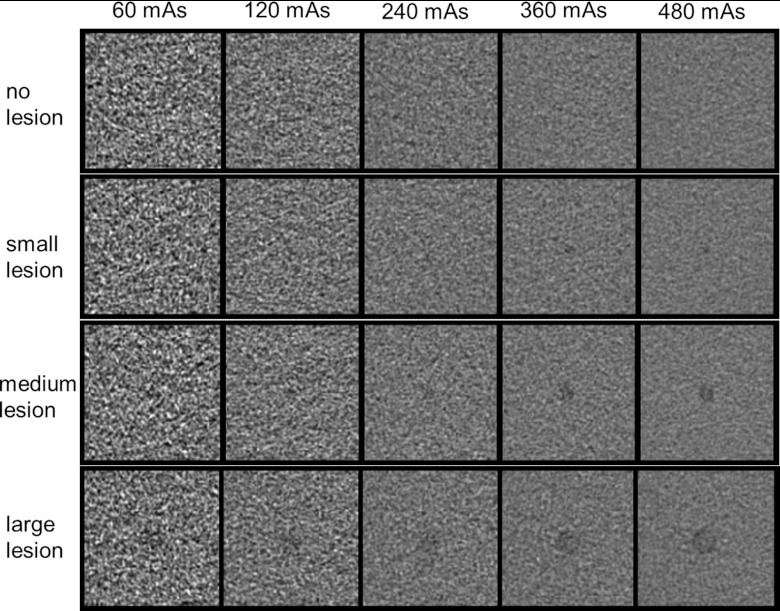
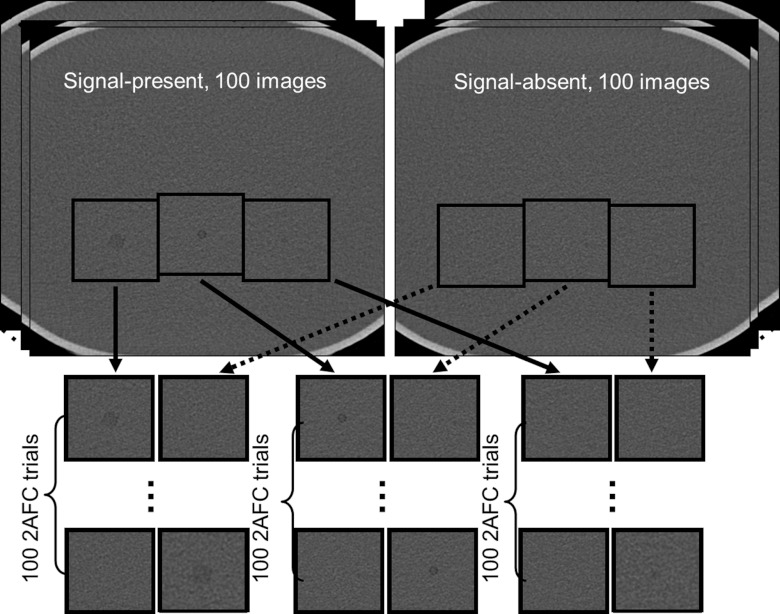
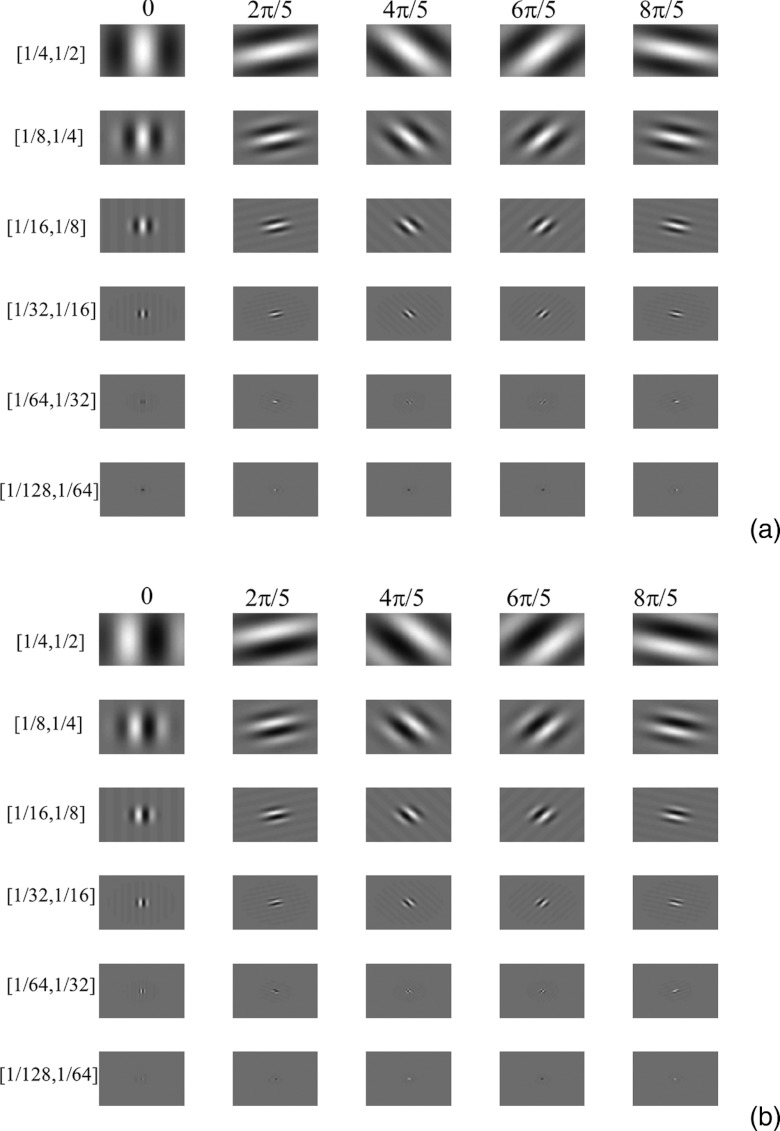
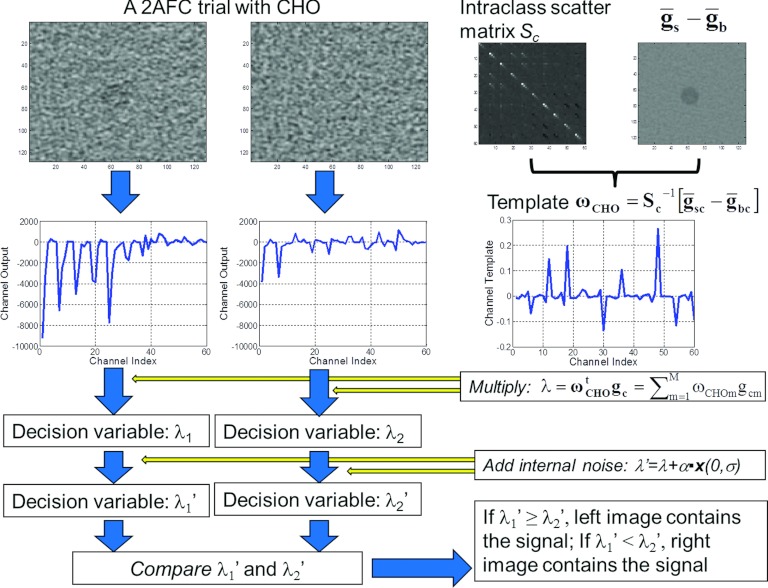
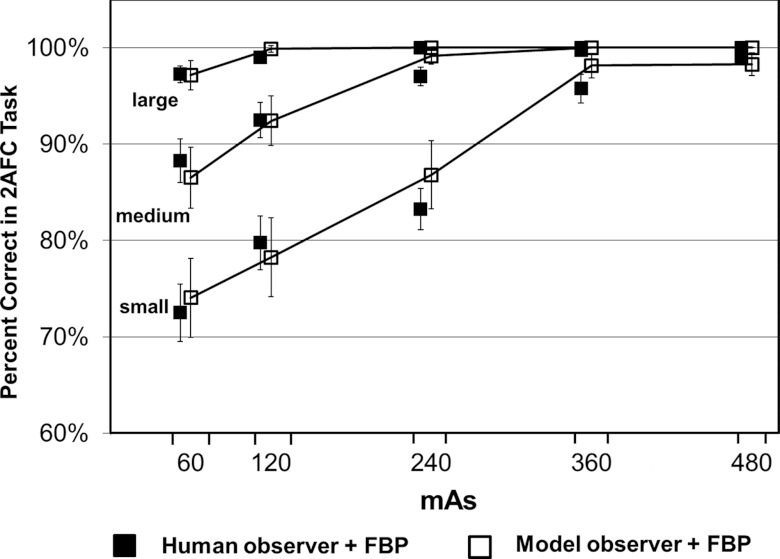
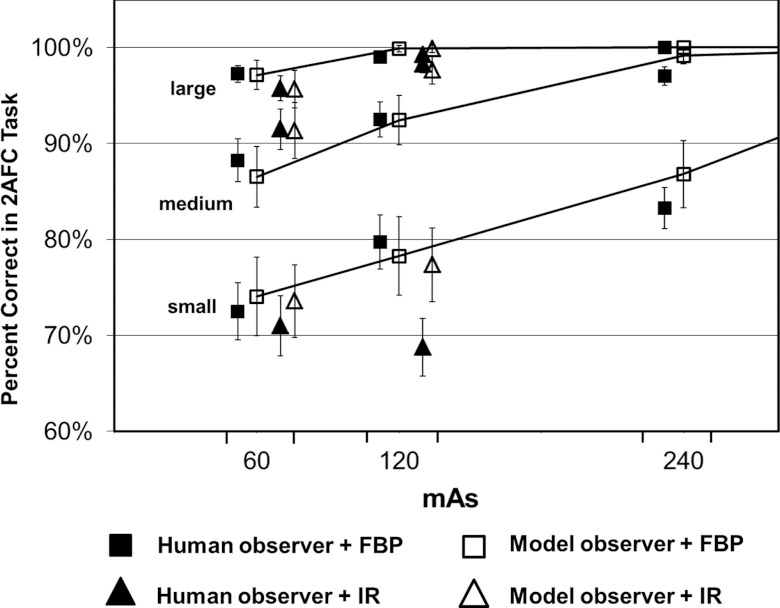
Methods: A 35 × 26 cm(2) torso-shaped phantom filled with water was used to simulate an average-sized patient. Three rods with different diameters (small: 3 mm; medium: 5 mm; large: 9 mm) were placed in the center region of the phantom to simulate small, medium, and large lesions. The contrast relative to background was -15 HU at 120 kV. The phantom was scanned 100 times using automatic exposure control each at 60, 120, 240, 360, and 480 quality reference mAs on a 128-slice scanner. After removing the three rods, the water phantom was again scanned 100 times to provide signal-absent background images at the exact same locations. By extracting regions of interest around the three rods and on the signal-absent images, the authors generated 21 2AFC studies. Each 2AFC study had 100 trials, with each trial consisting of a signal-present image and a signal-absent image side-by-side in randomized order. In total, 2100 trials were presented to both the model and human observers. Four medical physicists acted as human observers. For the model observer, the authors used a CHO with Gabor channels, which involves six channel passbands, five orientations, and two phases, leading to a total of 60 channels. The performance predicted by the CHO was compared with that obtained by four medical physicists at each 2AFC study.
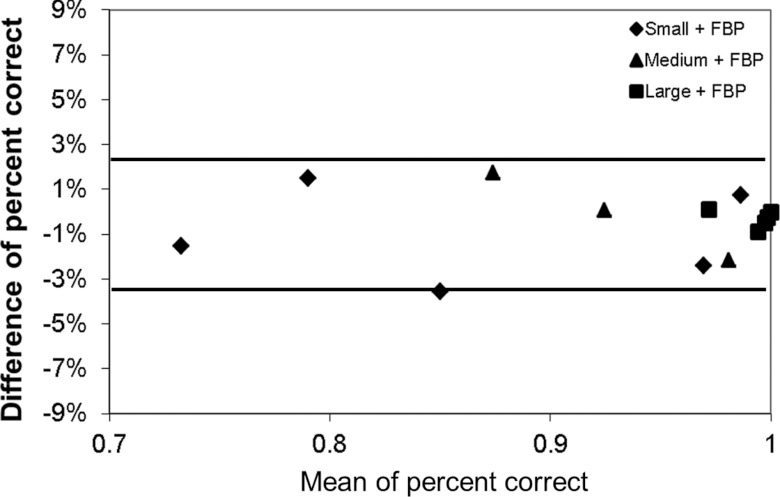
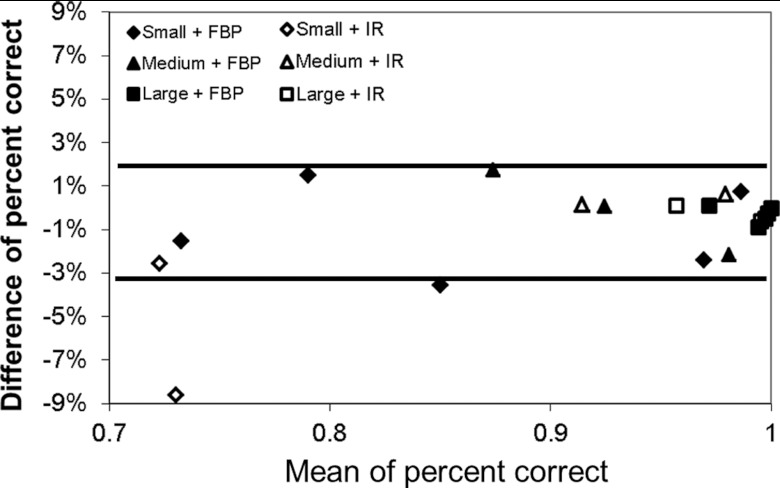
Results: The human and model observers were highly correlated at each dose level for each lesion size for both FBP and IR. The Pearson's product-moment correlation coefficients were 0.986 [95% confidence interval (CI): 0.958-0.996] for FBP and 0.985 (95% CI: 0.863-0.998) for IR. Bland-Altman plots showed excellent agreement for all dose levels and lesions sizes with a mean absolute difference of 1.0% ± 1.1% for FBP and 2.1% ± 3.3% for IR.
Conclusions: Human observer performance on a 2AFC lesion detection task in CT with a uniform background can be accurately predicted by a CHO model observer at different radiation dose levels and for both FBP and IR methods.
Figures
References
-
- National Council on Radiation Protection & Measurements (NCRP), “Ionizing radiation exposure of the population of the United States,” Report No. 160, 2009.
-
- AAPM CT Dose Summit, “Scan Parameter Optimization,” see http://www.aapm.org/meetings/2010CTS/default.asp. (2010).
-
- Singh S., Kalra M. K., Moore M. A., Shailam R., Liu B., Toth T. L., Grant E., and Westra S. J., “Dose reduction and compliance with pediatric CT protocols adapted to patient size, clinical indication, and number of prior studies,” Radiology 252, 200–208 (2009). 10.1148/radiol.2521081554 - DOI - PubMed
Publication types
MeSH terms
Grants and funding
LinkOut - more resources
Full Text Sources
Other Literature Sources
Medical
Miscellaneous
