

Sources of heterogeneity in human monocyte subsets
- PMID: 23557598
- PMCID: PMC3684771
- DOI: 10.1016/j.imlet.2013.03.004
Sources of heterogeneity in human monocyte subsets
Abstract
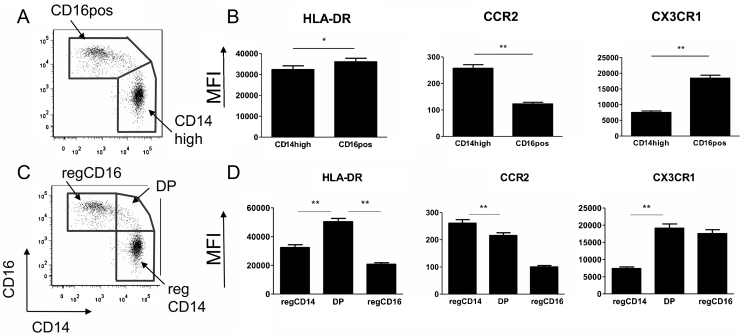
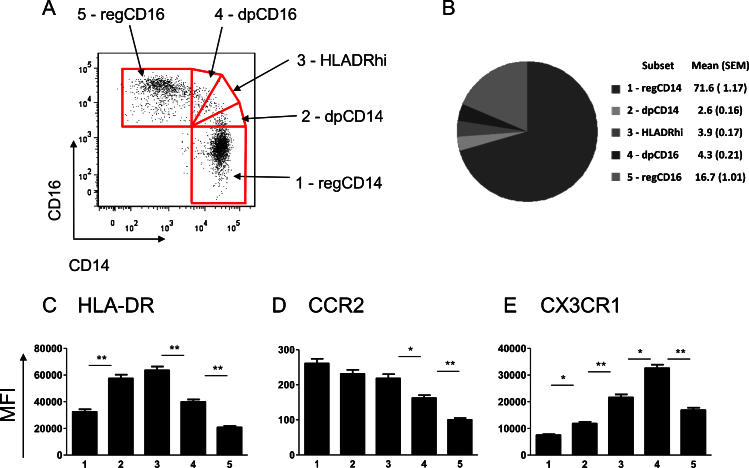
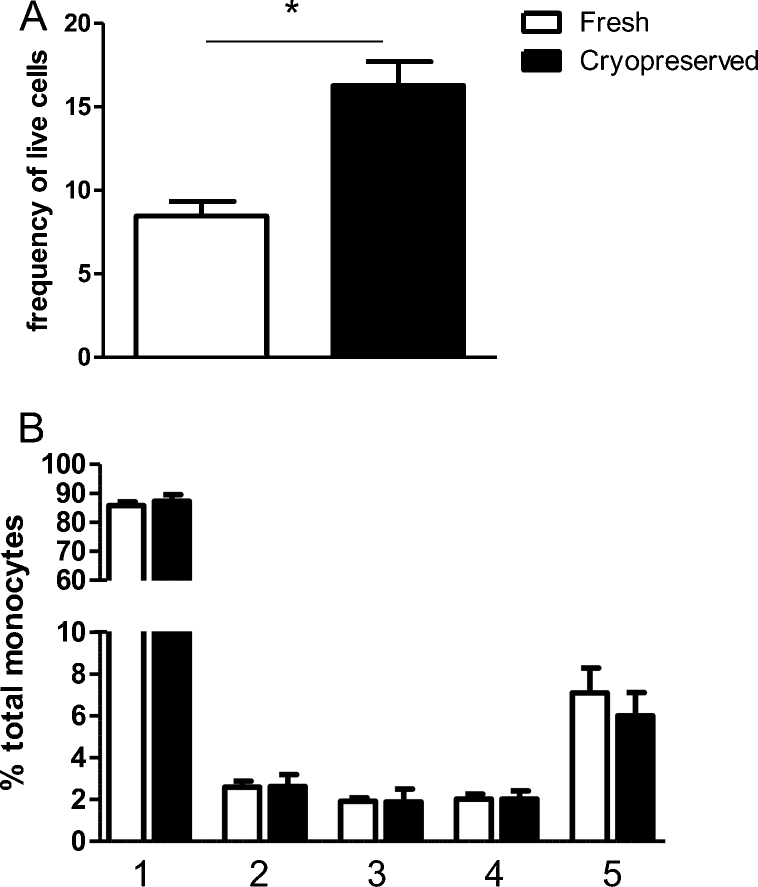
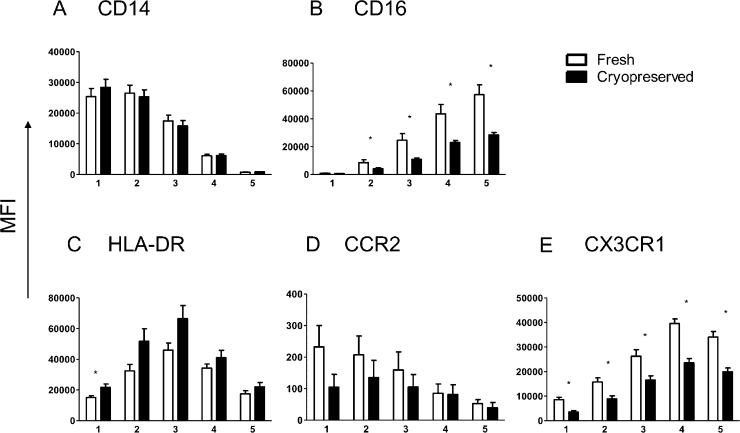
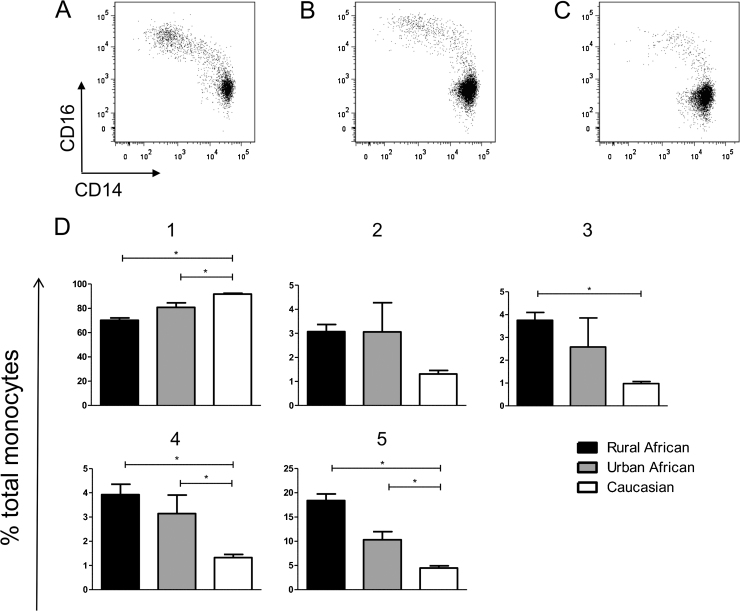
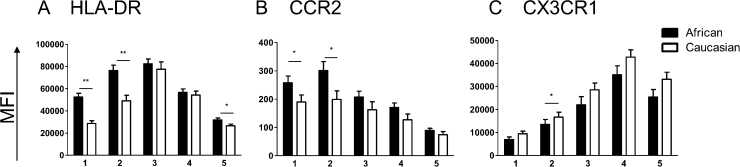
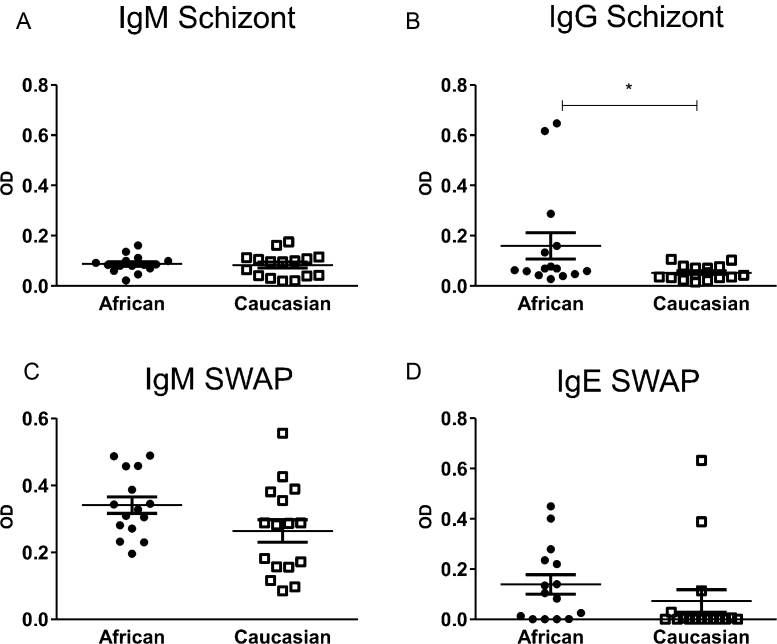
Human monocytes are commonly defined and discriminated by the extent of their cell surface expression of CD14 and CD16, with associated differences in function and phenotype related to the intensity of expression of these markers. With increasing interest into the function and behaviour of monocytes, it is important to have a clear understanding of how differing strategies of analysis can affect results and how different protocols and population backgrounds can affect this highly morphogenic cell type. Using PBMCs from populations with differing ethnicities and histories of parasite exposure we have characterized monocyte phenotype based on intensity of CD14 and CD16 expression. Using the surface markers HLA-DR, CCR2 and CX3CR1, we compared monocyte phenotype between populations and further assessed changes in monocytes with freezing and thawing of PBMCs. Our results reveal that there is a progression of surface marker expression based on intensity of CD14 or CD16 expression, stressing the importance of careful gating of monocyte subtypes. Freezing and thawing of the PBMCs has no effect generally on the monocytes, although it does lead to a decrease in CD16 and CX3CR1 expression. We show that there are differences in the monocyte populations based on ethnicity and history of exposure to the common parasites Plasmodium falciparum and Schistosoma haematobium. This study highlights that blood monocytes consist of a continuous population of cells, within which the dominant phenotype may vary dependent on the background of the study population. Comparing results from monocyte studies therefore needs to be done with great care, as ethnic background of donor population, gating strategy and processing of PBMCs may all have an effect on outcome of monocyte phenotype.
Copyright © 2013 Elsevier B.V. All rights reserved.
Figures

Similar articles
-
CD14, CD16 and HLA-DR reliably identifies human monocytes and their subsets in the context of pathologically reduced HLA-DR expression by CD14(hi) /CD16(neg) monocytes: Expansion of CD14(hi) /CD16(pos) and contraction of CD14(lo) /CD16(pos) monocytes in acute liver failure.Cytometry A. 2012 Oct;81(10):823-34. doi: 10.1002/cyto.a.22104. Epub 2012 Jul 26. Cytometry A. 2012. PMID: 22837127
-
Characterization of the CD14++CD16+ monocyte population in human bone marrow.PLoS One. 2014 Nov 4;9(11):e112140. doi: 10.1371/journal.pone.0112140. eCollection 2014. PLoS One. 2014. PMID: 25369328 Free PMC article.
-
Altered Monocyte Phenotype in HIV-1 Infection Tends to Normalize with Integrase-Inhibitor-Based Antiretroviral Therapy.PLoS One. 2015 Oct 2;10(10):e0139474. doi: 10.1371/journal.pone.0139474. eCollection 2015. PLoS One. 2015. PMID: 26430882 Free PMC article.
-
Monocyte subtypes and the CCR2 chemokine receptor in cardiovascular disease.Clin Sci (Lond). 2017 Jun 1;131(12):1215-1224. doi: 10.1042/CS20170009. Clin Sci (Lond). 2017. PMID: 28566450 Review.
-
Monocyte Differentiation and Heterogeneity: Inter-Subset and Interindividual Differences.Int J Mol Sci. 2023 May 15;24(10):8757. doi: 10.3390/ijms24108757. Int J Mol Sci. 2023. PMID: 37240103 Free PMC article. Review.
Cited by
-
Quantitative and Functional Assessment of the Influence of Routinely Used Cryopreservation Media on Mononuclear Leukocytes for Medical Research.Int J Mol Sci. 2022 Feb 7;23(3):1881. doi: 10.3390/ijms23031881. Int J Mol Sci. 2022. PMID: 35163803 Free PMC article.
-
Inherited and Environmental Factors Influence Human Monocyte Heterogeneity.Front Immunol. 2019 Nov 7;10:2581. doi: 10.3389/fimmu.2019.02581. eCollection 2019. Front Immunol. 2019. PMID: 31787976 Free PMC article. Review.
-
Characterization of Human Monocyte Subsets by Whole Blood Flow Cytometry Analysis.J Vis Exp. 2018 Oct 17;(140):57941. doi: 10.3791/57941. J Vis Exp. 2018. PMID: 30394370 Free PMC article.
-
Alteration of monocyte subsets and their functions in thalassemia patients.Int J Hematol. 2023 Feb;117(2):188-197. doi: 10.1007/s12185-022-03484-9. Epub 2022 Nov 2. Int J Hematol. 2023. PMID: 36323999 Free PMC article.
-
Polymerization of misfolded Z alpha-1 antitrypsin protein lowers CX3CR1 expression in human PBMCs.Elife. 2021 May 18;10:e64881. doi: 10.7554/eLife.64881. Elife. 2021. PMID: 34002692 Free PMC article.
References
-
- Passlick B., Flieger D., Ziegler-Heitbrock H. Identification and characterization of a novel monocyte subpopulation in human peripheral blood. Blood. 1989;74:2527–2534. - PubMed
-
- Ziegler-Heitbrock L., Ancuta P., Crowe S., Dalod M., Grau V., Hart D.N. Nomenclature of monocytes and dendritic cells in blood. Blood. 2010;116:e74–e80. - PubMed
-
- Gordon S., Taylor P.R. Monocyte and macrophage heterogeneity. Nat Rev Immunol. 2005;5:953–964. - PubMed
Publication types
MeSH terms
Substances
Grants and funding
LinkOut - more resources
Full Text Sources
Other Literature Sources
Medical
Research Materials
