. 2013 May 3;340(6132):626-30.
doi: 10.1126/science.1236062. Epub 2013 Apr 4.

An inhibitor of mutant IDH1 delays growth and promotes differentiation of glioma cells

Affiliations

An inhibitor of mutant IDH1 delays growth and promotes differentiation of glioma cells

Dan Rohle et al. Science. .

Abstract

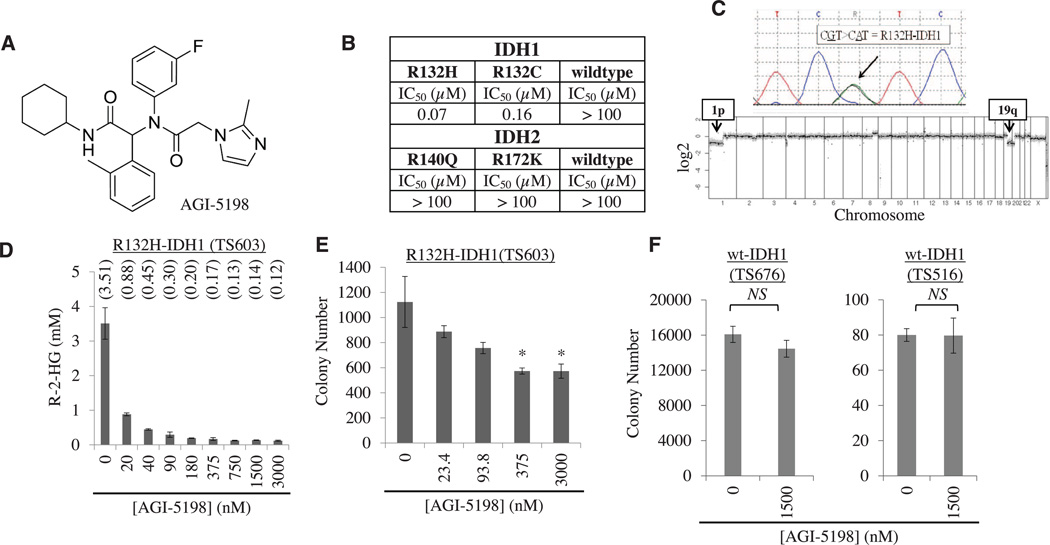
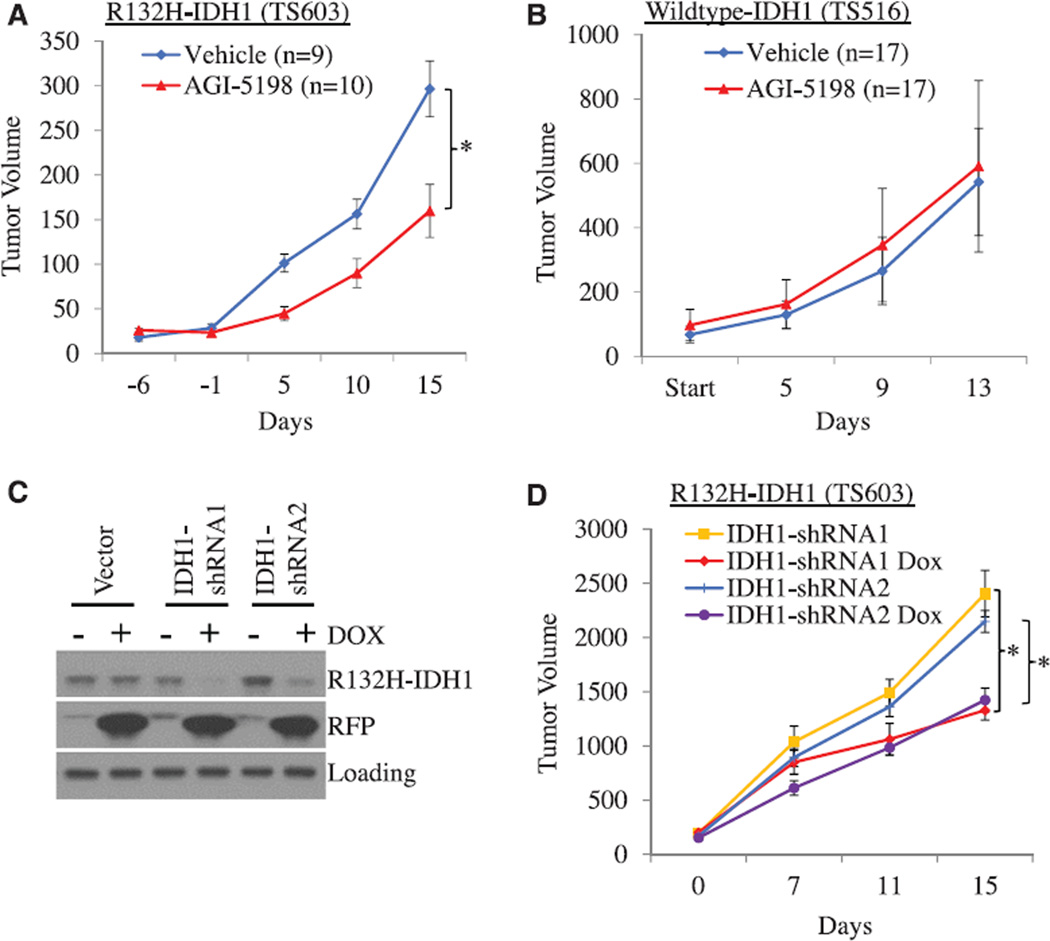
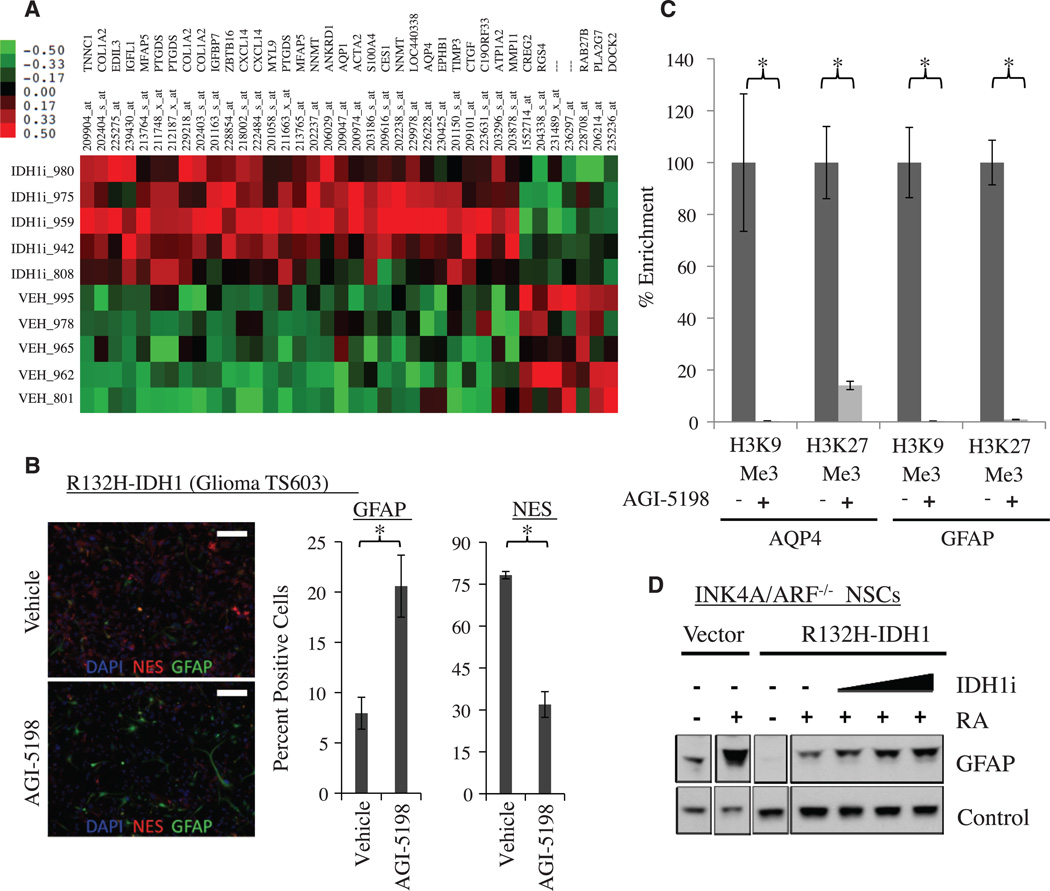
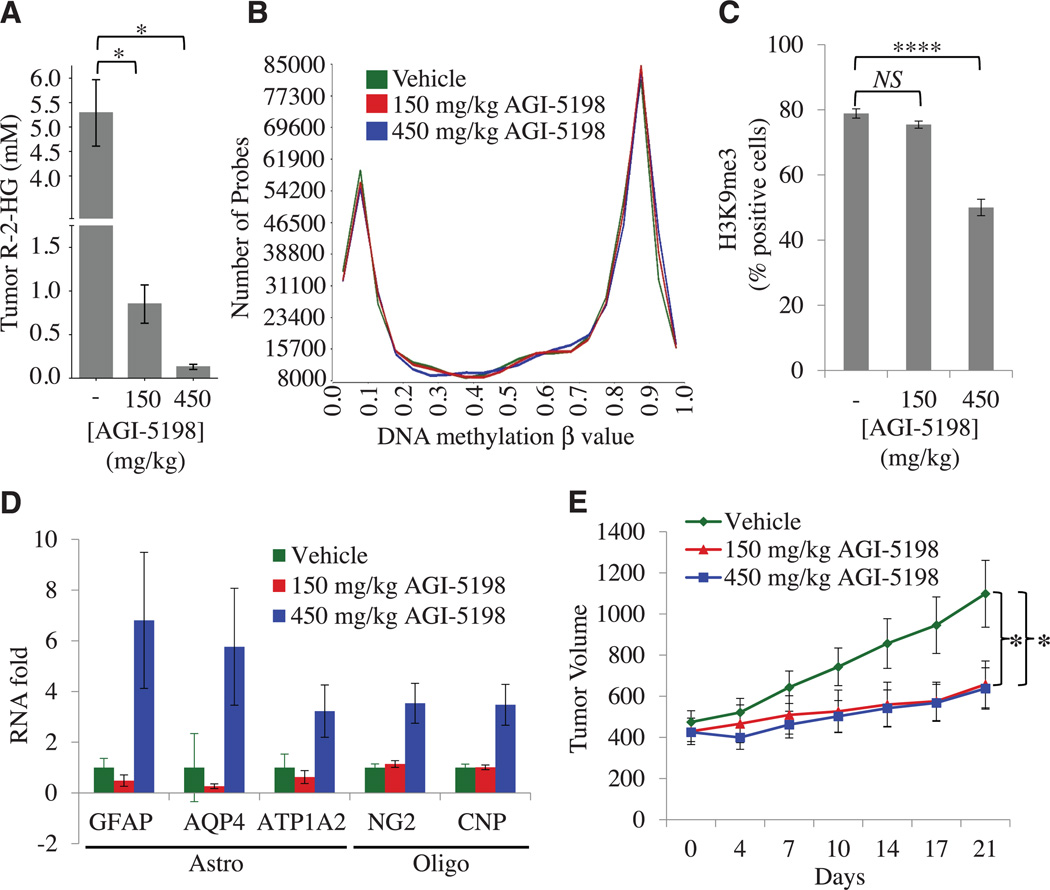
The recent discovery of mutations in metabolic enzymes has rekindled interest in harnessing the altered metabolism of cancer cells for cancer therapy. One potential drug target is isocitrate dehydrogenase 1 (IDH1), which is mutated in multiple human cancers. Here, we examine the role of mutant IDH1 in fully transformed cells with endogenous IDH1 mutations. A selective R132H-IDH1 inhibitor (AGI-5198) identified through a high-throughput screen blocked, in a dose-dependent manner, the ability of the mutant enzyme (mIDH1) to produce R-2-hydroxyglutarate (R-2HG). Under conditions of near-complete R-2HG inhibition, the mIDH1 inhibitor induced demethylation of histone H3K9me3 and expression of genes associated with gliogenic differentiation. Blockade of mIDH1 impaired the growth of IDH1-mutant--but not IDH1-wild-type--glioma cells without appreciable changes in genome-wide DNA methylation. These data suggest that mIDH1 may promote glioma growth through mechanisms beyond its well-characterized epigenetic effects.


Figures

Fig. 1
Fig. 1. An R132H-IDH1 inhibitor blocks R-2HG production and soft-agar growth of IDH1-mutant glioma cells
(A) Chemical structure of AGI-5198. (B) IC50 of AGI-5198 against different isoforms of IDH1 and IDH2, measured in vitro. (C) Sanger sequencing chromatogram (top) and comparative genomic hybridization profile array (bottom) of TS603 glioma cells. (D) AGI-5198 inhibits R-2HG production in R132H-IDH1 mutant TS603 glioma cells. Cells were treated for 2 days with AGI-5198, and R-2HG was measured in cell pellets. R-2HG concentrations are indicated above each bar (in mM). Error bars, mean ± SEM of triplicates. (E and F) AGI-5198 impairs soft-agar colony formation of (E) IDH1-mutant TS603 glioma cells [*P < 0.05, one-way analysis of variance (ANOVA)] but not (F) IDH1–wild-type glioma cell lines (TS676 and TS516). Error bars, mean ± SEM of triplicates.
Fig. 2
Fig. 2. AGI-5198 impairs growth of IDH1-mutant glioma xenografts in mice
(A) AGI-5198 impairs growth of IDH1±mutant TS603 glioma xenografts (*P = 0.015, two-tailed t test). Error bars, mean ± SEM. (B) AGI-5198 does not impair the growth of IDH1–wild-type TS516 glioma xenografts. Treatment with AGI-5198 (450 mg/kg per day via gavage) was started after subcutaneous xenografts were established. Error bars, mean ± SEM. (C) Inducible knockdown of IDH1 in IDH1-mutant glioma cells. Shown are Western blots from TS603 cells engineered to express either empty vector or IDH1-shRNAs from a doxycycline-inducible cassette and treated with doxycycline (2.5 µg/mL) for 6 days before lysis. (D) IDH1 knockdown impairs growth of IDH1-mutant glioma xenografts. Mice were randomized to vehicle versus doxycycline after subcutaneous tumors were established (*P < 0.05, two-tailed t test; n = 15 mice per cohort). Error bars, mean ± SEM.
Fig. 3
Fig. 3. AGI-5198 promotes astroglial differentiation in R132H-IDH1 mutant cells
(A) Heat map of genes that are up- or down-regulated in TS603 glioma xenografts treated with AGI-5198 (more than twofold up or down). (B) Increased expression of GFAP (green) and decreased expression of NES (red) in TS603 cells treated in vitro with AGI-5198. Shown are immunofluorescence images of cells incubated in 1% fetal bovine serum (FBS) and 1 µM retinoic acid for 7 days in the presence of vehicle (top) or 1.5 µM AGI-5198 (bottom). Scale bar, 200 µM. The bar graph on the right represents a quantification of GFAP and NES staining (*P < 0.05, two-tailed t test). DAPI (4´,6-diamidino-2-phenylindole) staining in blue. Error bars, mean ± SEM of triplicates. (C) AGI-5198 promotes removal of repressive H3K9me3 and H3K27me3 marks at the GFAP and AQP4 promoters. Shown is ChIP (percent enrichment normalized to vehicle) of TS603 cells grown for 7 days in FBS (1%) and retinoic acid (1 µM) in the presence of vehicle or 1.5 µM AGI-5198 (*P < 0.05, two-tailed t test). Error bars, mean ± SEM for four repeats. (D) Blockade of mIDH1 restores the ability of R132HIDH1 mutant Ink4a/Arf−/− murine neuroprogenitor cells (NPCs) to express GFAP in response to retinoic acid. Shown is a Western blot of parental (vector) and R132H-IDH1 expressing Ink4a/Arf−/− NPCs treated with 1 µM retinoic acid (RA) in the presence of vehicle or mIDH1 inhibitor.
Fig. 4
Fig. 4. Dose-dependent inhibition of histone methylation in IDH1-mutant gliomas after shortterm treatment with AGI-5198
(A) Intratumoral concentrations of R-2HG in TS603 xenografts treated for 2 weeks with vehicle (n = 10 mice per cohort), 150 mg/kg AGI-5198 (n = 10 mice per cohort), or 450 mg/kg AGI-5198 (n = 8 mice per cohort) (*P < 0.05, two-tailed t test). Error bars, mean ± SEM. (B) Genome-wide distribution of DNA methylation in TS603 glioma xenografts treated for 2 weeks with vehicle, 150 mg/kg AGI-5198, or 450 mg/kg AGI-5198. (C) Effect of AGI-5198 on H3K9 trimethylation in TS603 glioma xenografts. Shown is the quantification of IHC results (****P < 0.00001) (see also fig. S11). Error bars, mean ± SEM of triplicates. (D) RNA levels of astrocytic (GFAP, AQP4, and ATP1A2) and oligodendrocytic (NG2 and CNP) differentiation markers in vehicle-versus AGI-5198– treated TS603 xenografts (P = 4 × 10⁻⁸, ANOVA). RNA expression was measured by RT-PCR. Error bars, mean ± SEM for 7 or 8 repeats (7 for vehicle, 8 for 150 mg/kg, and 7 for 450 mg/kg). (E) Tumor volumes of TS603 xenografts in mice treated with vehicle, 150 mg/kg AGI-5198, or 450 mg/kg AGI-5198 (*P < 0.05, two-tailed t test); n = 10 mice per cohort. Error bars, mean ± SEM.

Comment in

Similar articles

Cited by

References

    1. Parsons DW, et al. Science. 2008;321:1807. - PMC - PubMed
    1. Yan H, et al. N. Engl. J. Med. 2009;360:765. - PMC - PubMed
    1. Amary MF, et al. J. Pathol. 2011;224:334. - PubMed
    1. Borger DR, et al. Oncologist. 2012;17:72. - PMC - PubMed
    1. Paschka P, et al. J. Clin. Oncol. 2010;28:3636. - PubMed

Publication types

MeSH terms

Associated data