. 2013 May;41(9):4877-87.
doi: 10.1093/nar/gkt210. Epub 2013 Apr 4.

Differential binding of the related transcription factors Pho4 and Cbf1 can tune the sensitivity of promoters to different levels of an induction signal

Affiliations

Differential binding of the related transcription factors Pho4 and Cbf1 can tune the sensitivity of promoters to different levels of an induction signal

Jonathan S Z Aow et al. Nucleic Acids Res. 2013 May.

Abstract

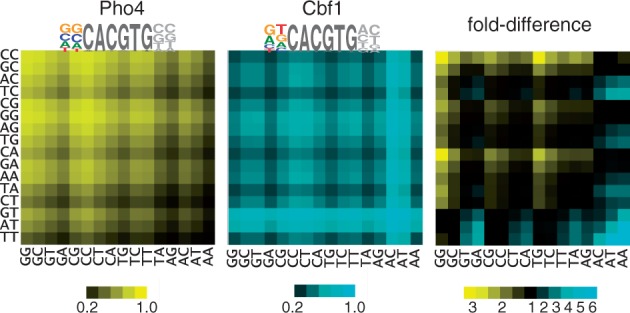
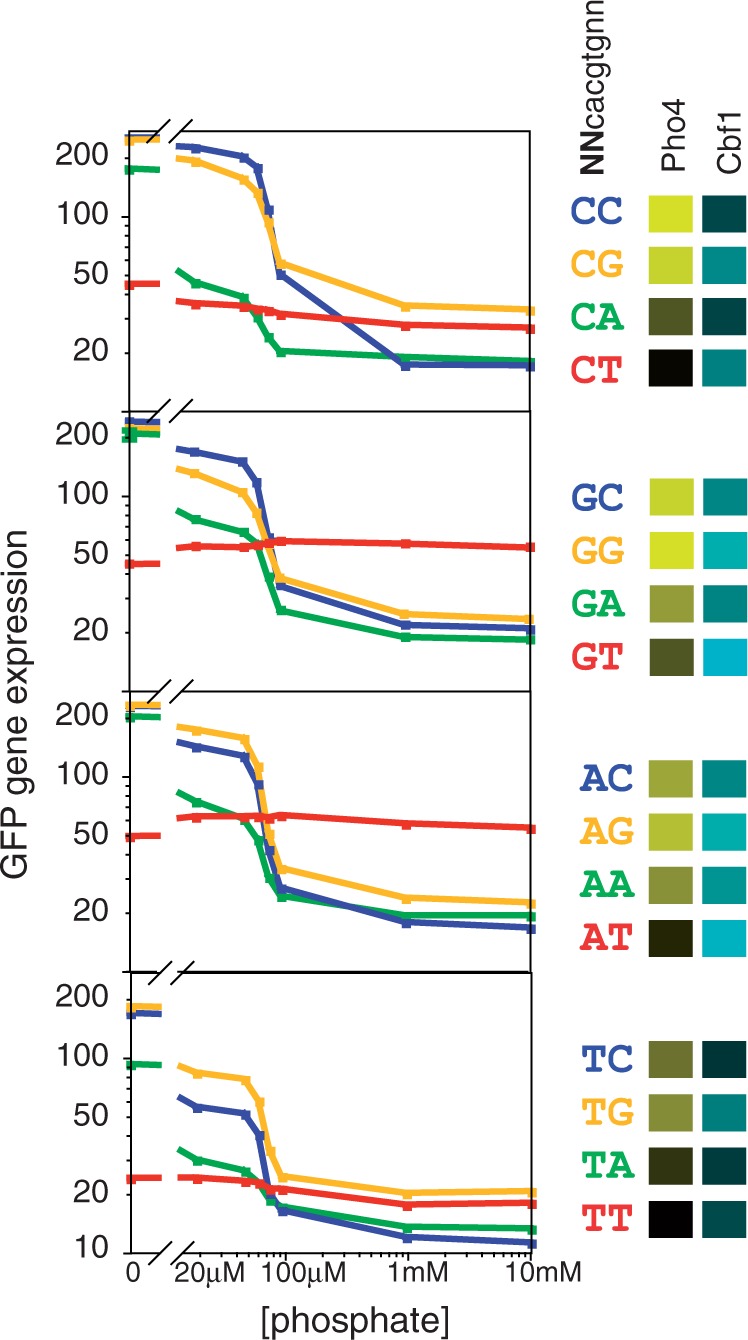
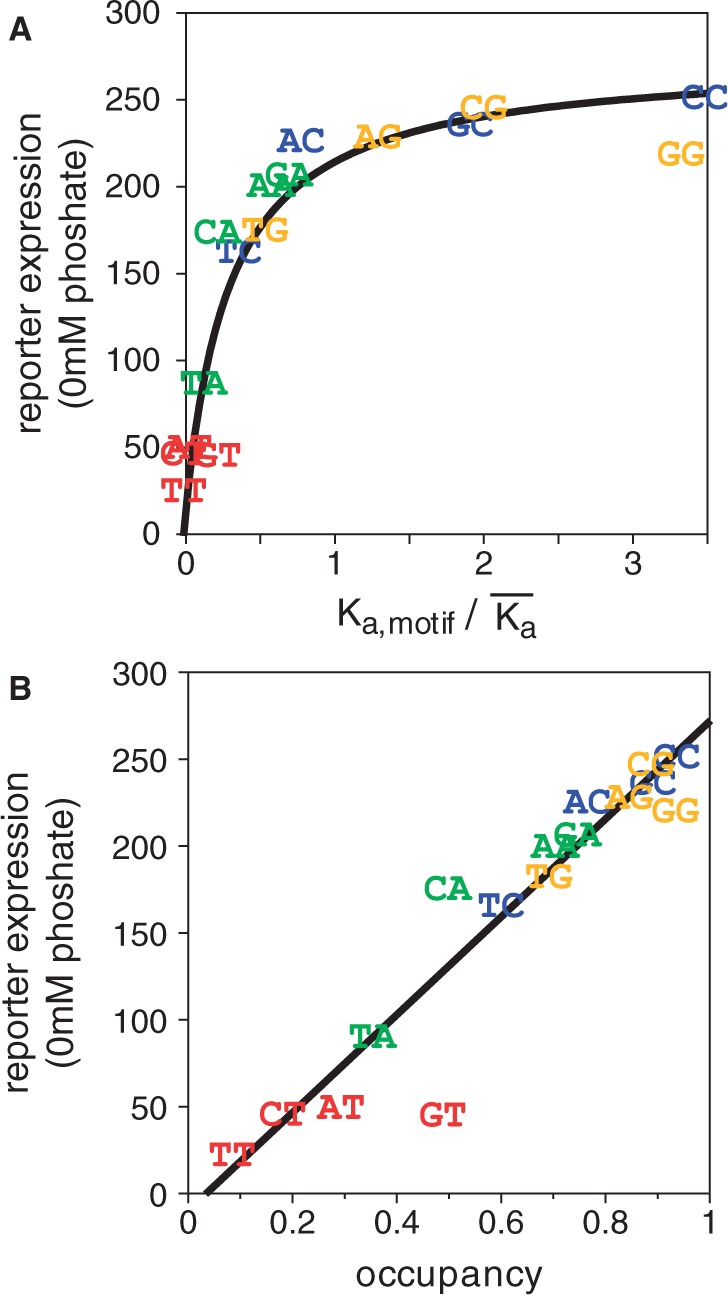
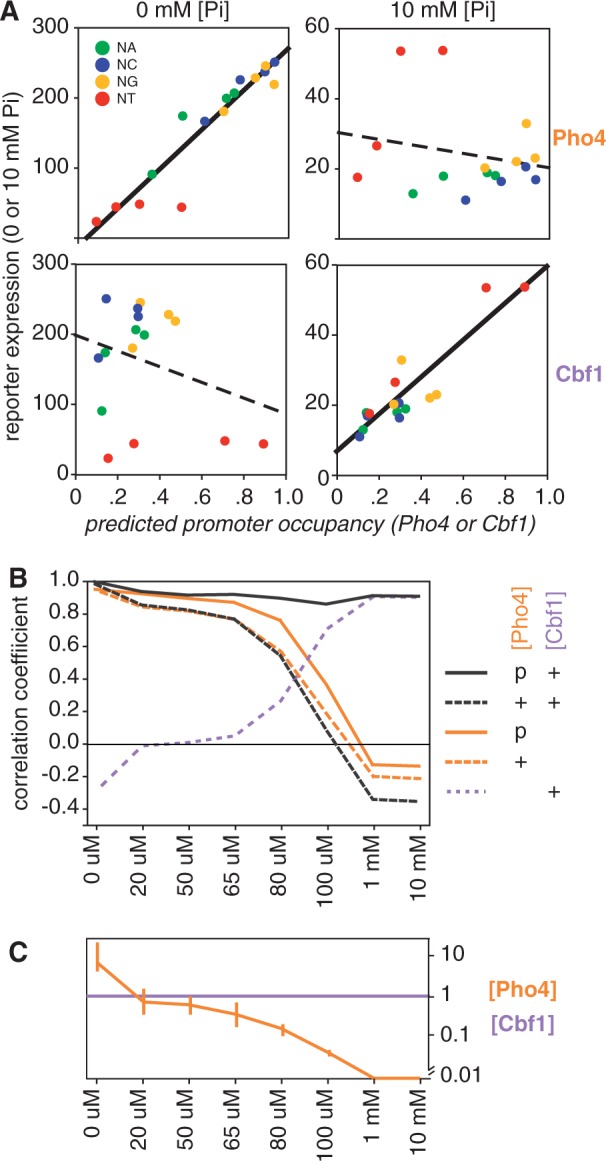
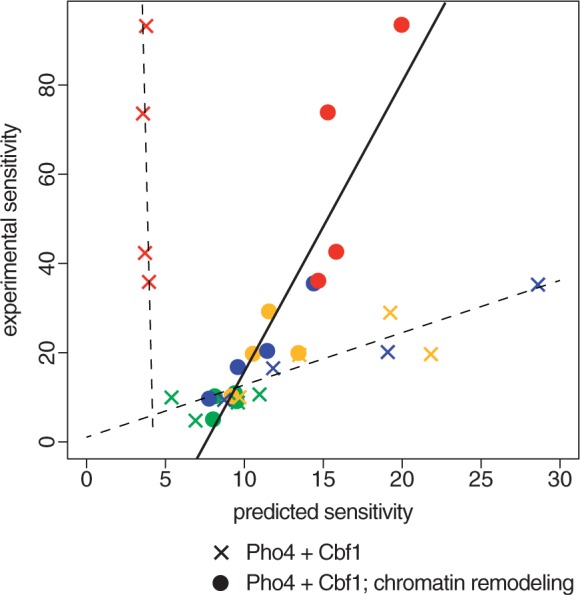
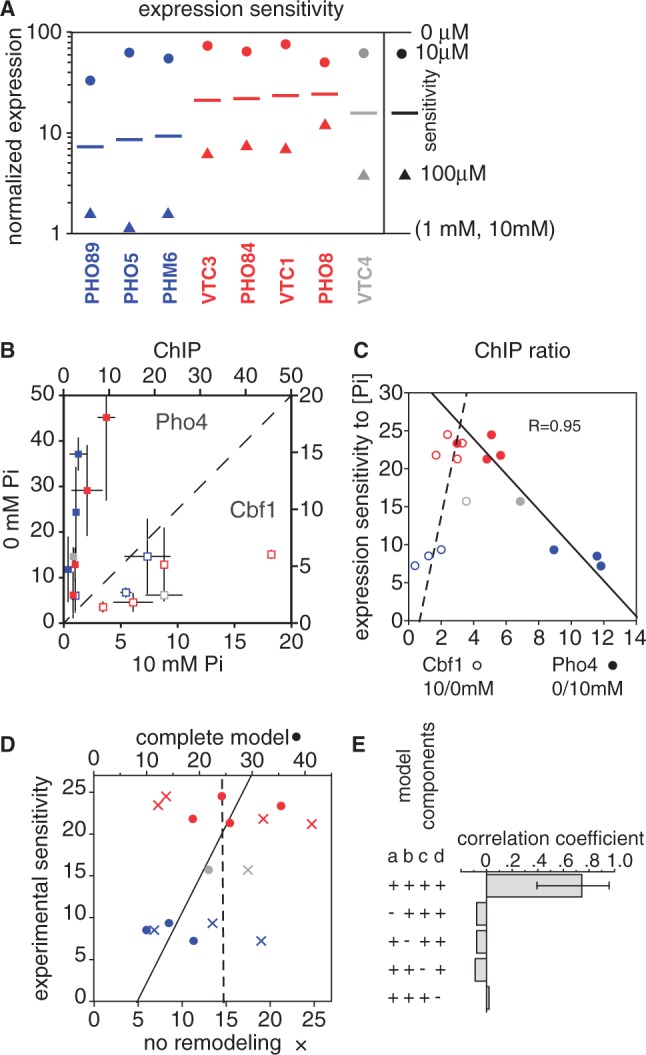
Transcription factors that belong to the same family typically have similar, but not identical, binding specificities. As such, they can be expected to compete differentially for binding to different variants of their binding sites. Pho4 is a yeast factor whose nuclear concentration is up-regulated in low phosphate, while the related factor, Cbf1, is constitutively expressed. We constructed 16 GFP-reporter genes containing all palindromic variants of the motif NNCACGTGNN, and determined their activities at a range of phosphate concentrations. Pho4 affinity did not explain expression data well except under fully induced conditions. However, reporter activity was quantitatively well explained under all conditions by a model in which Cbf1 itself has modest activating activity, and Pho4 and Cbf1 compete with one another. Chromatin immunoprecipitation and computational analyses of natural Pho4 target genes, along with the activities of the reporter constructs, indicates that genes differ in their sensitivity to intermediate induction signals in part because of differences in their affinity for Cbf1. The induction sensitivity of both natural Pho4 target genes and reporter genes was well explained only by a model that assumes a role for Cbf1 in remodeling chromatin. Our analyses highlight the importance of taking into account the activities of related transcription factors in explaining system-wide gene expression data.


Figures

Figure 1.
Figure 1.
Heatmaps showing relative occupancy by Pho4 and Cbf1 at all 256 variants of the binding site NNCACGTGNN; rows indicate the 5′ dinucleotide, columns the 3′ dinucleotide. Occupancies for Pho4 and Cbf1 (left and center, respectively) are based on the relative free energies of binding for dinucleotides flanking the CACGTG core (8), with the assumed protein concentration adjusted so the mean occupancy among all sites is 0.5. The fold-difference between Pho4 and Cbf1 occupancies is shown in the panel on the right, with motifs having higher occupancy for Pho4 shown in blue and those with higher occupancy for Cbf1 shown in yellow. The sequence logos for Pho4 and Cbf1 are based on a consensus CACGTG core plus flanking base preferences that are derived from a linear regression of the experimentally measured free energy differences for the 16 dinucleotide free energy values (8). The result is a best-fit estimation for the relative contributions to binding of each of the four bases at each of the two positions.
Figure 2.
Figure 2.
Phosphate-concentration dependence of gene expression from promoters containing each of the 16 possible palindromic Pho4/Cbf1 motifs (NNCACGTGNN). The four graphs group sites according to the identity of the distal flanking base; for example, the top graph shows expression for the four promoters that contain variants of CNCACGTGNG. Within each graph, the color denotes the base immediately 5′ to the core hexamer; for example, the blue line in each graph indicates a variant of NCCACGTGGN. Also shown in this panel are the relative affinities of the 16 sites for Pho4 and Cbf1, according to the color scheme in Figure 1.
Figure 3.
Figure 3.
(A) Reporter expression levels under fully inducing conditions (0 mM phosphate) plotted against relative Pho4 binding affinity. Motifs are indicated by the same two bases used in Figure 2. The data have been fit to a standard binding isotherm, yielding an apparent protein concentration, relative to the mean affinity, of 4 (Methods). (B) Alternative representation of the data in panel A, based on calculating the predicted occupancy of each motif at a protein concentration 4 times the mean Kd. The line is a linear fit of expression versus predicted occupancy.
Figure 4.
Figure 4.
Expression and predicted binding. (A) Correlation between reporter gene expression at different phosphate concentrations and the predicted occupancy of Pho4 to 16 palindromic binding sites. (A: top left) Expression in 0 mM phosphate, reproducing data in Figure 2C. Solid line indicates a high linear correlation coefficient (R = 0.94). (A: top right) Expression at 10 mM phosphate. The dashed line indicates a weak inverse correlation between expression and Pho4 binding (R = −0.22). (A: bottom two panels) Analogous to the top panels, but using predicted Cbf1 occupancy rather than Pho4; a concentration of 1 was used (equivalent to the mean of the relative Kd’s). Note the strong correlation at 10 mM phosphate and the weak correlation at 0 mM phosphate, opposite to what is observed for Pho4. (B) Changes in correlation coefficient with predicted binding as expression levels change in response to different phosphate concentrations. Expression was predicted using five variations of the model as indicated in the key. ‘+’ Indicates a fixed concentration of [Pho4] = 4, as in panel A and in Figure 2, or a concentration of 1 in the case of Cbf1. ‘p’ indicates the parameterization of [Pho4], optimizing the fit at each phosphate concentration. (C) The transcription factor concentrations used at each phosphate concentration to obtain the best fit between predicted and observed expression (solid black line in panel B). The error bars on the Pho4 concentration line represent the range of concentrations that produce correlation coefficients within 0.015 of the optimal value shown in panel B (See Methods).
Figure 5.
Figure 5.
Reporters with high Cbf1: Pho4 affinity ratios show a sensitivity to induction that is anomalously high based on the simple Pho4 + Cbf1 model (X’s), but are explained well a model that assumes a role for bound Cbf1 in shifting promoter chromatin structures toward a more accessible state (circles). Sensitivities were calculated as described in the text. Colors indicate the NA (green), NC (blue), NG (yellow) and NT (red) reporters as in other figures.
Figure 6.
Figure 6.
Sensitivity of natural promoters to intermediate phosphate concentrations is related to Cbf1 affinity. (A) Normalized gene expression levels at different phosphate concentrations. Expression was determined by microarray analysis at 0 μM, 10 μM, 100 μM, 1 mM and 10 mM [Pi], and was normalized between a value of 1 (average for 1 and 10 mM, as these were similarly low) and 100 (0 μM). As indicated in the legend, the colored circles represent the expression level in 10 μM phosphate, while triangles shows expression in 100 μM phosphate. The line midway between the two is the log-average of these values; we use this value as a measure of the sensitivity of a gene to intermediate phosphate. Blue and red genes are the same as those classified by Kim and O’Shea (25) as having low and high thresholds for induction, and are colored in the same way. [Some gene names are different, reflecting changes in the nomenclature used in the Saccharomyces Genome Database (SGD) (20)]. VTC4 (gray) has been included in this analysis, as its promoter was the basis for the reporter experiments described here. (B) ChIP of Pho4 (closed squares) and Cbf1 (open squares) in high and low phosphate. Values and error bars are the average and standard error of enrichment values for two sets of experiments using Myc-tagged and HA-tagged proteins (Methods). Colors are as in panel A. (C) Correlation of induction sensitivity with the change in transcription factor binding. The fold-difference in ChIP enrichment values are shown for both for Pho4 (closed squares; 0/10 mM phosphate) and Cbf1 (open squares; 10/0 mM). Note that the Pho4 and Cbf1 ChIP enrichment ratios can be compared for a given gene because the two values share the same y-axis values. (D) Correlation between the experimentally determined phosphate sensitivity of expression and two in silico predictions. One (X’s) is the model used for the reporter constructs in Figure 4, which takes into account competition between Cbf1 and Pho4 and ascribes a low level of transcriptional activity to bound Cbf1. The second model (circles) includes the same terms, but also models chromatin changes as reported for the reporter gene sensitivity values in Figure 5. The dashed and solid lines indicate fits to these predictions, respectively. The parameters used, and an analysis of the sensitivity to those parameters, are shown in Supplementary Figure S11. (E) Correlation coefficients for the chromatin remodeling model shown in panel D, along with the effect of leaving out certain terms. The error bars for the top histogram bar indicates the 95% confidence interval for the correlation as defined by bootstrap resampling. Leaving out any term that is required for modeling the cooperative effects of Cbf1 chromatin remodeling results in an insignificant correlation. The terms are labeled a–d: (a) are there two states for the promoter, ‘open’ and ‘closed’?; (b) is there tighter binding of Pho4 and Cbf1 to the ‘open’ state?; (c) does Cbf1 binding shift the equilibrium toward the open state?; (d) is Cbf1 included in the model at all?

Similar articles

Cited by

References

    1. Badis G, Chan ET, van Bakel H, Pena-Castillo L, Tillo D, Tsui K, Carlson CD, Gossett AJ, Hasinoff MJ, Warren CL, et al. A library of yeast transcription factor motifs reveals a widespread function for Rsc3 in targeting nucleosome exclusion at promoters. Mol. Cell. 2008;32:878–887. - PMC - PubMed
    1. Badis G, Berger MF, Philippakis AA, Talukder S, Gehrke AR, Jaeger SA, Chan ET, Metzler G, Vedenko A, Chen X, et al. Diversity and complexity in DNA recognition by transcription factors. Science. 2009;324:1720–1723. - PMC - PubMed
    1. Johnson AD, Poteete AR, Lauer G, Sauer RT, Ackers GK, Ptashne M. λ Repressor and cro—components of an efficient molecular switch. Nature. 1981;294:217–223. - PubMed
    1. Pierce M, Benjamin KR, Montano SP, Georgiadis MM, Winter E, Vershon AK. Sum1 and Ndt80 proteins compete for binding to middle sporulation element sequences that control meiotic gene expression. Mol. Cell. Biol. 2003;23:4814–4825. - PMC - PubMed
    1. Granek JA, Clarke ND. Explicit equilibrium modeling of transcription-factor binding and gene regulation. Genome Biol. 2005;6:R87. - PMC - PubMed

Publication types

MeSH terms

Substances