. 2013 Apr 4;4(4):e569.
doi: 10.1038/cddis.2013.86.

Inhibition of 12/15-lipoxygenase by baicalein induces microglia PPARβ/δ: a potential therapeutic role for CNS autoimmune disease

Affiliations

Inhibition of 12/15-lipoxygenase by baicalein induces microglia PPARβ/δ: a potential therapeutic role for CNS autoimmune disease

J Xu et al. Cell Death Dis. .

Abstract

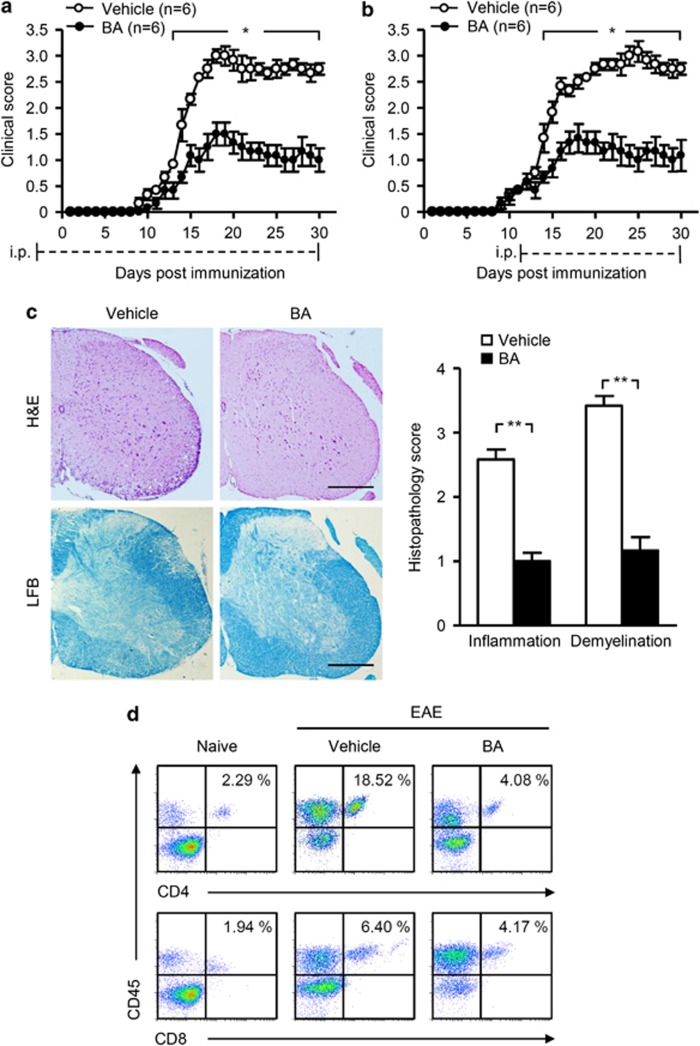
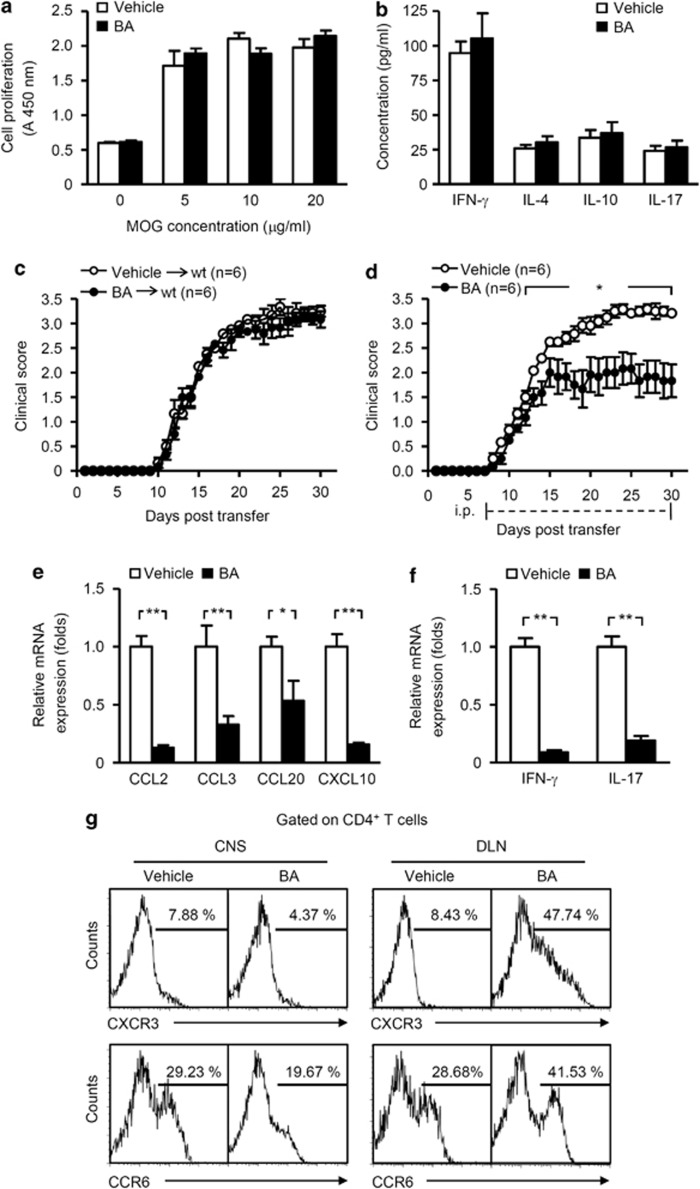
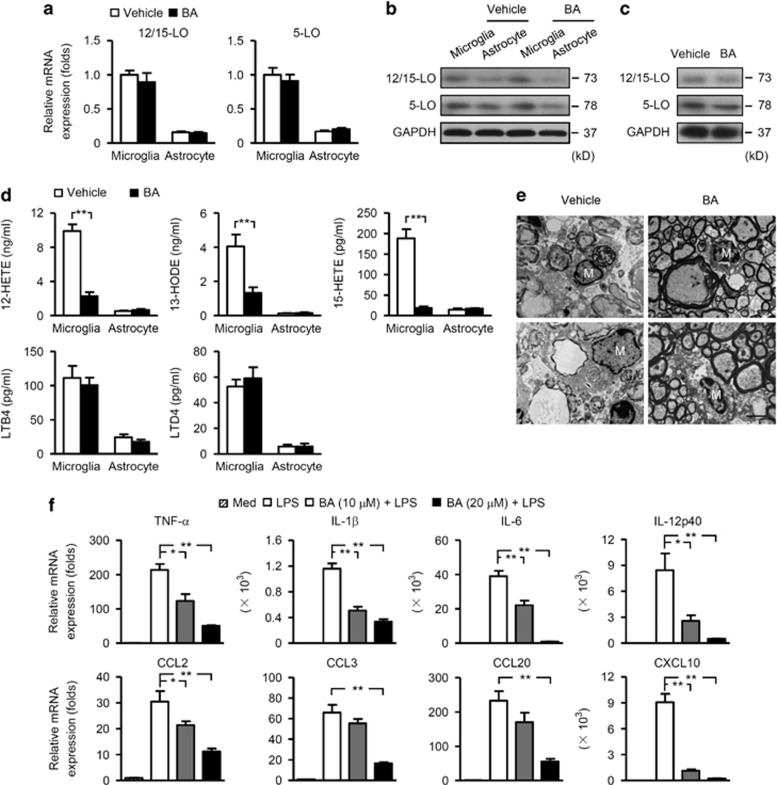
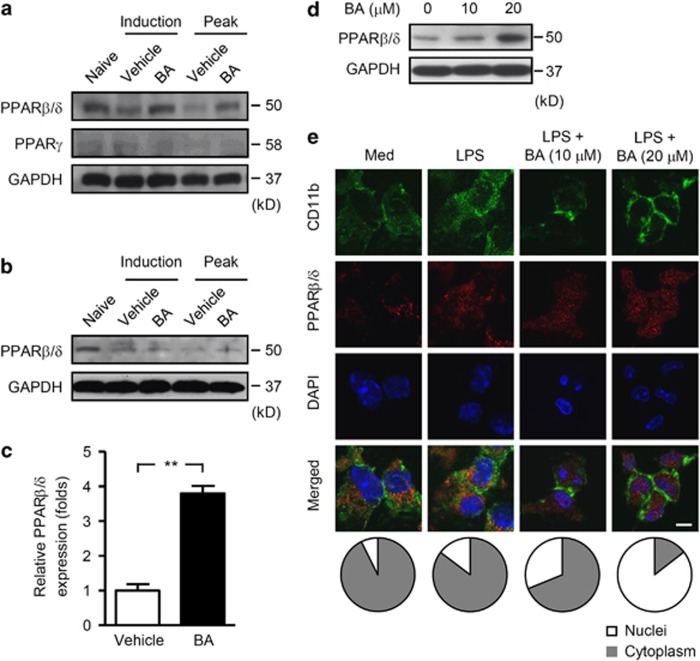
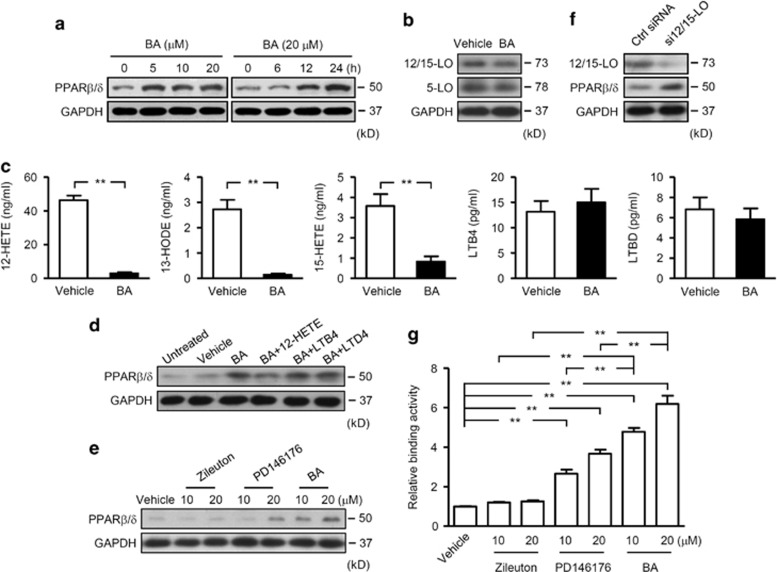
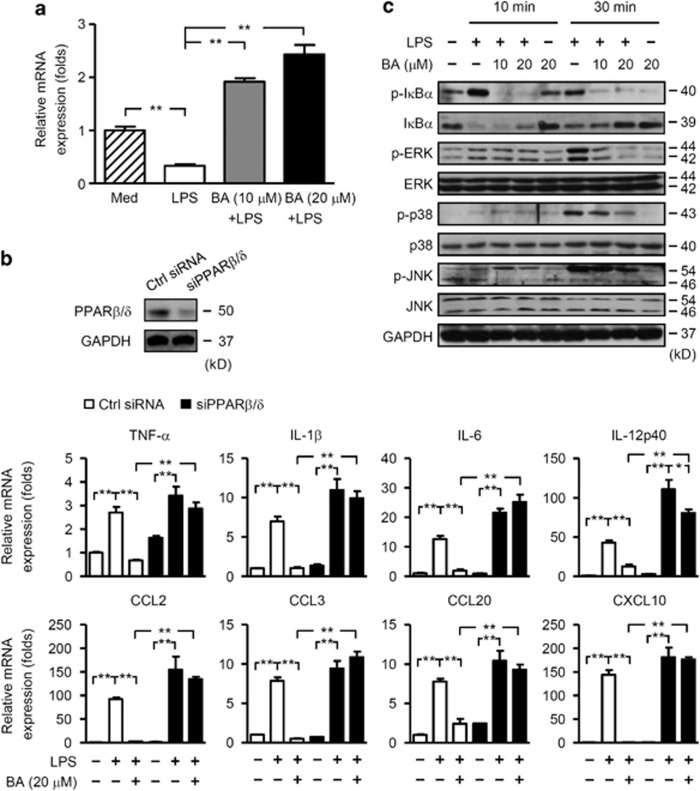
12/15-Lipoxygenase (12/15-LO) is an enzyme that converts polyunsaturated fatty acids into bioactive lipid derivatives. In this study, we showed that inhibition of 12/15-LO by baicalein (BA) significantly attenuated clinical severity of experimental autoimmune encephalomyelitis (EAE), an animal model of multiple sclerosis (MS). Inhibited migration of autoimmune T cells into the central nervous system (CNS) by BA treatment could be attributed to reduced activation of microglia, which was indicated by suppressed phagocytosis, and decreased production of proinflammatory cytokines and chemokines in the CNS. We further observed that inhibition of 12/15-LO with BA led to increased expression of peroxisome proliferator-activated receptor (PPAR)β/δ in microglia of EAE mice. This was confirmed in vitro in primary microglia and a microglia cell line, BV2. In addition, we demonstrated that BA did not affect 12/15-LO or 5-lipoxygenase (5-LO) expression in microglia, but significantly decreased 12/15-LO products without influencing the levels of 5-LO metabolites. Moreover, among these compounds only 12/15-LO metabolite 12-hydroxyeicosatetraenoic acid was able to reverse BA-mediated upregulation of PPARβ/δ in BV2 cells. We also showed that inhibition of microglia activation by PPARβ/δ was associated with repressed NF-κB and MAPK activities. Our findings indicate that inhibition of 12/15-LO induces PPARβ/δ, demonstrating important regulatory properties of 12/15-LO in CNS inflammation. This reveals potential therapeutic applications for MS.


Figures

Figure 1
Figure 1
The 12/15-LO inhibitor BA ameliorated EAE severity. (a and b) Clinical scores of EAE mice subjected to vehicle or BA treatment with the preventive (a) and treatment (b) protocols. Results are shown as mean±S.E.M. (n=6 mice per group) and representative of three independent experiments with similar results. (c and d) EAE mice were subjected to vehicle or BA treatment with the preventive protocol. Spinal cord sections were stained with H&E (left, top) or LFB (left, bottom) on day 20 post immunization. Original magnification, × 40. Cellular infiltration in H&E sections and demyelinated areas in LFB-stained sections were summarized as mean±S.E.M. (n=6) on the right. Scale bars, 500 μm (c). Flow cytometry were performed to analyze infiltration of CD45+CD4+ and CD45+CD8+ T cells in the spinal cords on day 10 post immunization (d). Results in c (left) and d are representative of three independent experiments. *P<0.05; **P<0.01
Figure 2
Figure 2
BA reduced autoimmune cell infiltration into the CNS without impairing immune responses in the periphery. (ac and eg) EAE mice were subjected to vehicle or BA treatment with the preventive protocol, 10 days after MOG peptide immunization, DLNs, spleens and spinal cords were isolated for further experiments. (a) DLN cells and splenocytes were re-challenged with the MOG peptide at the indicated concentrations for 3 days and examined for proliferation. Data are shown as mean±S.E.M. (n=6). (b) Culture supernatants derived from cells re-challenged with 20 μg/ml of MOG peptide for 48 h were collected for cytokine measurement by ELISA. Results in a and b are shown as mean±S.E.M. (n=6). (c) DLN cells and splenocytes re-challenged with 10 μg/ml of MOG peptide for 3 days were transferred into sublethally irradiated mice (6 Gy). Recipients were monitored and scored daily. (d) DLN cells and splenocytes were isolated from EAE mice on day 10 and re-challenged with 10 μg/ml of MOG peptide for 3 days and were transferred into sublethally irradiated mice to induce EAE. Recipients were treated with vehicle or BA (75 mg/kg/day) from day 7 post-transfer onward. Clinical scores were monitored daily. Results in c and d are shown as mean±S.E.M. (n=6 mice per group) and representative of three independent experiments with similar results. (e and f) Real-time PCR analyses of mRNAs of chemokines and cytokines in the spinal cords. Data are normalized to the gene expression in vehicle-treated mice and shown as mean±S.E.M. (n=6). (g) Flow cytometry analyses of CXCR3 and CCR6 expression on CD4+ T cells in the spinal cords and DLNs. Results are representative of three independent experiments with similar results. *P<0.05; **P<0.01
Figure 3
Figure 3
BA suppressed CNS inflammation through inhibition of microglia activation. (a) Real-time PCR analyses of 12/15-LO (left) and 5-LO (right) expression in primary microglia or astrocytes. Data are normalized to the gene expression in vehicle-treated cells and shown as mean±S.E.M. (n=6). (b) Immunoblot analyses of 12/15-LO and 5-LO in vehicle- or BA-treated primary microglia and astrocytes. (c) CD11b+ cells were isolated from the spinal cords of vehicle- or BA-treated EAE mice on day 10 post immunization. Levels of 12/15-LO and 5-LO were determined by immunoblot analyses. (d) Primary microglia and astrocytes were treated with vehicle or 20 μM BA for 24 h. Levels of 12-HETE, 13-HODE, 15-HETE, LTB4 and LTD4 in the supernatants were measured by ELISA. Results are shown as mean±S.E.M. (n=6). (e) EM images of microglia (M) in spinal cords of vehicle- or BA-treated EAE mice. Original magnification, × 4200. Scale bar, 2.5 μm. (f) Primary microglia were left untreated or treated with vehicle or BA (10 or 20 μM) for 12 h and then stimulated with LPS (100 ng/ml) for 3 h. Expression of proinflammatory cytokines and chemokines were analyzed by real-time PCR. Data are normalized to the gene expression in vehicle-treated microglia without LPS stimulation and shown as mean±S.E.M. (n=6). Results in b, c and e are representative of three independent experiments with similar results. *P<0.05; **P<0.01
Figure 4
Figure 4
BA-induced PPARβ/δ in microglia. (ac) EAE mice were subjected to vehicle or BA treatment with the preventive protocol, spinal cords (a) and DLNs (b) were isolated on day 10 (a representative day of induction phase) and day 20 (a representative day of peak phase) post immunization for immunoblot analyses of PPARβ/δ (a and b) and PPARγ (a). Samples isolated from naive mice were set as controls. (c) CD11b+ cells were isolated from spinal cords on day 10 post immunization for detection of PPARβ/δ by real-time PCR. Data are normalized to the gene expression in vehicle-treated mice and shown as mean±S.E.M. (n=6). (d) Primary microglia treated with vehicle or BA (10 or 20 μM) for 24 h were subjected to immunoblot analyses of PPARβ/δ. (e) Primary microglia were cultured in the absence or presence of vehicle or BA (10 or 20 μM) for 24 h and followed by stimulation with 100 ng/ml of LPS for 3 h, then subjected to immunofluorescence microscopy of CD11b (green) and PPARβ/δ (red). Cells were counter stained with DAPI (blue) to indicate nuclei. Scale bar, 20 μm (top). The fluorescence intensity of PPARβ/δ in nuclei and cytoplasm areas was quantitated using ImageJ software. The relative constituent ratios of PPARβ/δ in nuclei and cytoplasm are shown to indicate the intensity and localization of PPARβ/δ in nuclei and cytoplasm (bottom). Results in a, b, d and e are representative of three independent experiments with similar results. **P<0.01
Figure 5
Figure 5
BA-induced PPARβ/δ in microglia through inhibition of 12/15-LO. (a) Immunoblot analyses of PPARβ/δ in BV2 cells treated with BA at indicated concentrations (left) or different time points (right). (b and c) BV2 cells were treated with vehicle or BA treatment for 24 h, cells were then subjected to immunoblot analyses of 12/15-LO and 5-LO (b). Supernatants were collected for analyses of 12-HETE, 13-HODE, 15-HETE, LTB4 and LTD4 by ELISA (c). Results are shown as mean±S.E.M. (n=6). (d) BV2 cells were left untreated or treated with vehicle or 20 μM BA. For cells treated with BA, 12-HETE (100 pM), LTB4 (100 nM) or LTD4 (100 nM) was included in the culture. After 24 h, cells were harvested for analyses of PPARβ/δ by immunoblots. (e) Immunoblot analyses of PPARβ/δ in BV2 cells subjected to vehicle, Zileuton (10 or 20 μM), PD146176 (10 or 20 μM) or BA (10 or 20 μM) treatment for 24 h. (f) BV2 cells were transfected with control (Ctrl) siRNA or 12/15-LO siRNA (si12/15-LO) and cultured for 24 h, then subjected to immunoblot analyses of 12/15-LO and PPARβ/δ. (g) BV2 cells were treated as described in e. Nuclear extracts were subjected to ELISA analyses of DNA-binding activities. Data are normalized to the activity of nuclear extracts from BV2 cells treated with vehicle. Results in c and g are shown as mean±S.E.M. (n=6). Results in a, b and df are representative of three independent experiments with similar results. **P<0.01
Figure 6
Figure 6
Inhibition of microglia activation by PPARβ/δ was associated with repression of NF-κB and MAPK activities. (a) Primary microglia were treated with vehicle or BA for 12 h. Cells were then stimulated with or without LPS (100 ng/ml) for 3 h. Levels of PPARβ/δ mRNA were analyzed by real-time PCR. Data are normalized to the gene expression in vehicle-treated microglia without LPS stimulation and shown as mean±S.E.M. (n=6). (b) Top, BV2 cells were transfected with control (Ctrl) siRNA or PPARβ/δ siRNA (siPPARβ/δ) and cultured for 24 h, then subjected to immunoblot analyses of PPARβ/δ. Middle and bottom, BV2 cells were transfected with control (Ctrl) siRNA or PPARβ/δ siRNA. Cells were pre-treated with vehicle or BA (20 μM) for 12 h, and then cultured in the absence or presence of LPS for 3 h. Expression of proinflammatory cytokines and chemokines were analyzed by real-time PCR. Data are normalized to the gene expression in vehicle-treated VB2 cells without LPS stimulation and shown as mean±S.E.M. (n=6). (c) BV2 cells were pre-treated with vehicle or BA (10 or 20 μM) for 12 h, and then cultured in the absence or presence of LPS for 10 or 30 min. Levels of IκBα, p-IκBα, p38, p-p38, JNK, p-JNK, ERK and p-ERK were determined by immunoblot analyses. Results in b (top) and c are representative of three independent experiments with similar results. *P<0.05; **P<0.01

References

    1. Weinstock-Guttman B, Zivadinov R, Mahfooz N, Carl E, Drake A, Schneider J, et al. Serum lipid profiles are associated with disability and MRI outcomes in multiple sclerosis. J Neuroinflammation. 2011;8:127. - PMC - PubMed
    1. Wheeler D, Bandaru VV, Calabresi PA, Nath A, Haughey NJ. A defect of sphingolipid metabolism modifies the properties of normal appearing white matter in multiple sclerosis. Brain. 2008;131:3092–3102. - PMC - PubMed
    1. Tzartos JS, Friese MA, Craner MJ, Palace J, Newcombe J, Esiri MM, et al. Interleukin-17 production in central nervous system-infiltrating T cells and glial cells is associated with active disease in multiple sclerosis. Am J Pathol. 2008;172:146–155. - PMC - PubMed
    1. Serada S, Fujimoto M, Mihara M, Koike N, Ohsugi Y, Nomura S, et al. IL-6 blockade inhibits the induction of myelin antigen-specific Th17 cells and Th1 cells in experimental autoimmune encephalomyelitis. Proc Natl Acad Sci USA. 2008;105:9041–9046. - PMC - PubMed
    1. Jack C, Ruffini F, Bar-Or A, Antel JP. Microglia and multiple sclerosis. J Neurosci Res. 2005;81:363–373. - PubMed

Publication types

MeSH terms

LinkOut - more resources