

Defining pyromes and global syndromes of fire regimes
- PMID: 23559374
- PMCID: PMC3631631
- DOI: 10.1073/pnas.1211466110
Defining pyromes and global syndromes of fire regimes
Abstract
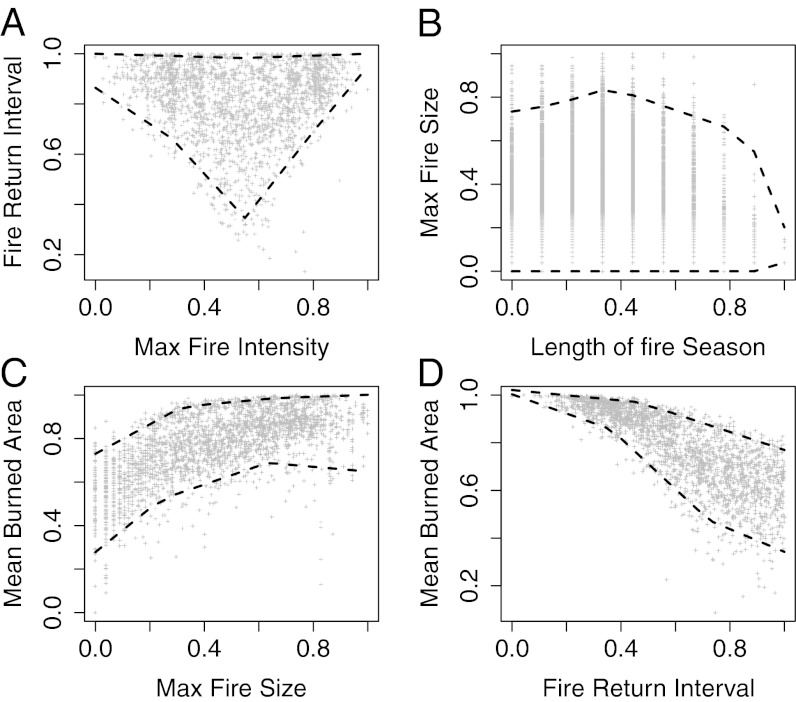
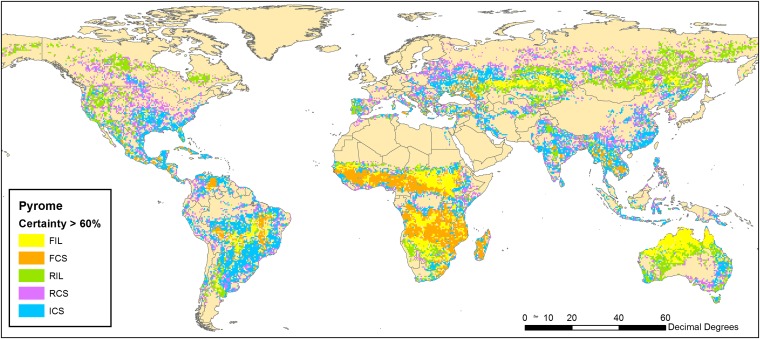
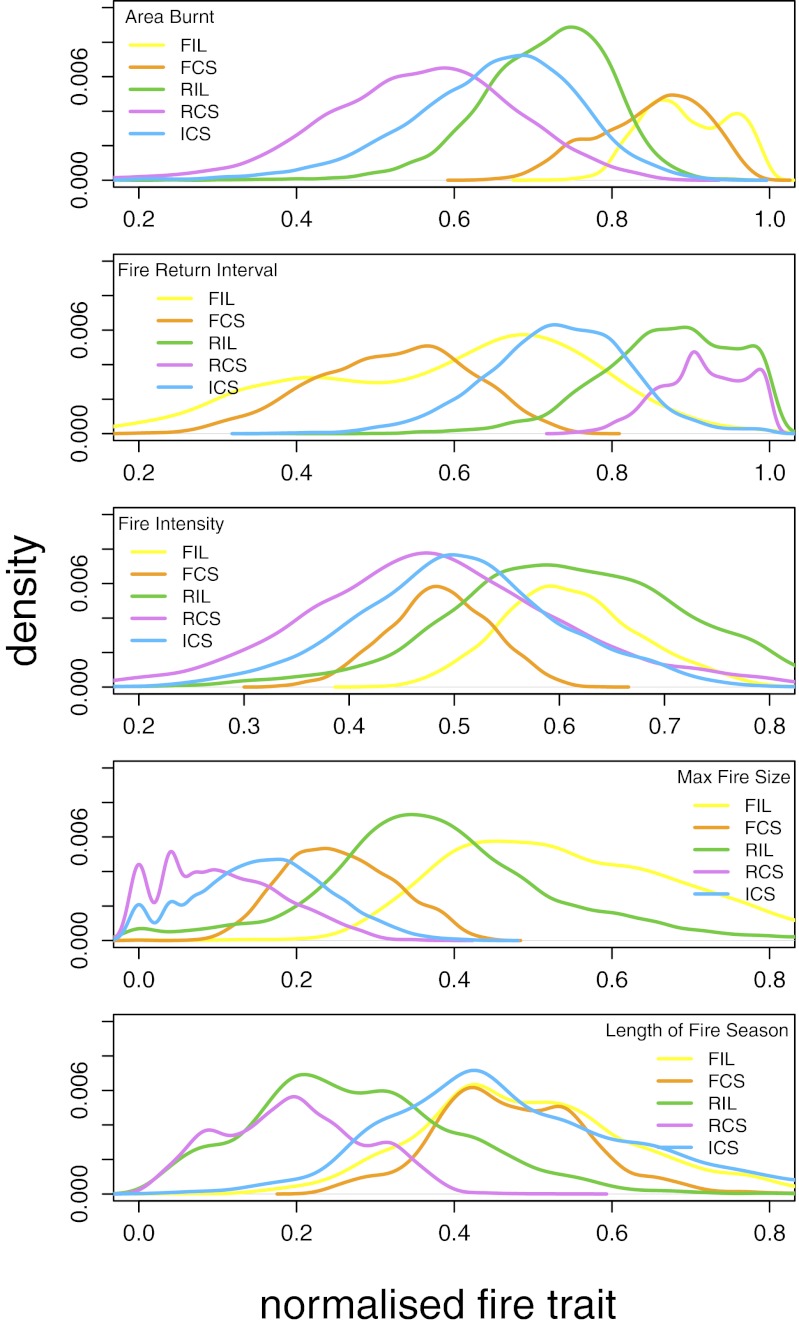
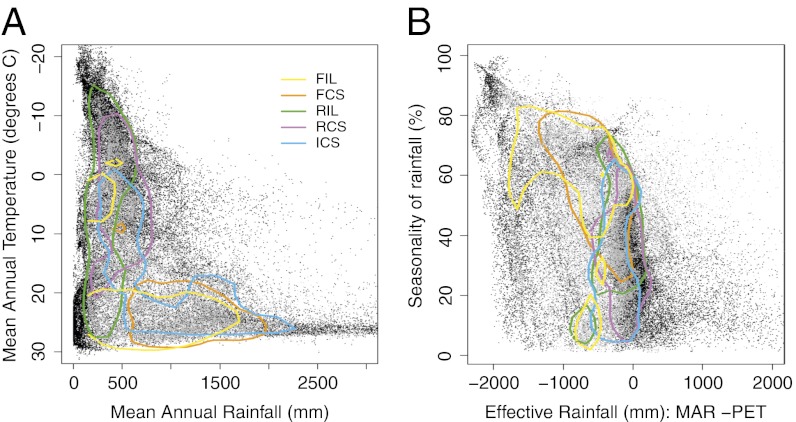
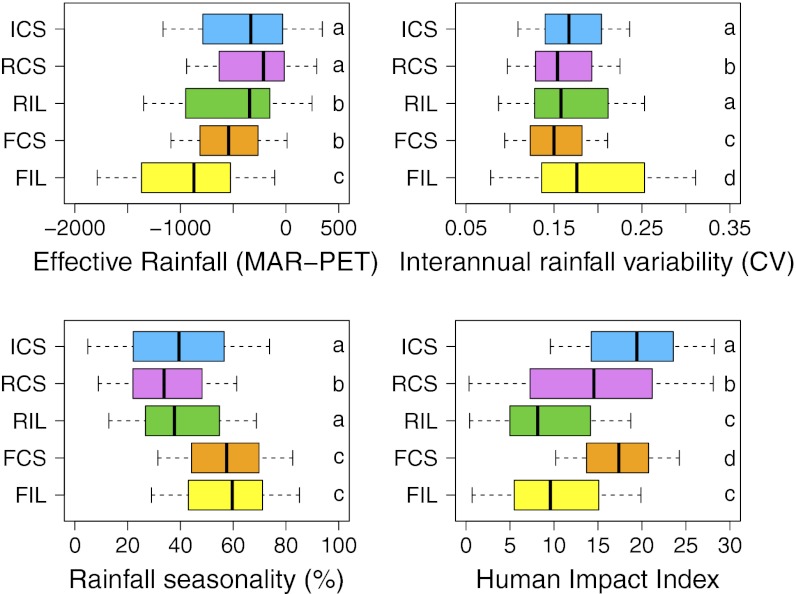
Fire is a ubiquitous component of the Earth system that is poorly understood. To date, a global-scale understanding of fire is largely limited to the annual extent of burning as detected by satellites. This is problematic because fire is multidimensional, and focus on a single metric belies its complexity and importance within the Earth system. To address this, we identified five key characteristics of fire regimes--size, frequency, intensity, season, and extent--and combined new and existing global datasets to represent each. We assessed how these global fire regime characteristics are related to patterns of climate, vegetation (biomes), and human activity. Cross-correlations demonstrate that only certain combinations of fire characteristics are possible, reflecting fundamental constraints in the types of fire regimes that can exist. A Bayesian clustering algorithm identified five global syndromes of fire regimes, or pyromes. Four pyromes represent distinctions between crown, litter, and grass-fueled fires, and the relationship of these to biomes and climate are not deterministic. Pyromes were partially discriminated on the basis of available moisture and rainfall seasonality. Human impacts also affected pyromes and are globally apparent as the driver of a fifth and unique pyrome that represents human-engineered modifications to fire characteristics. Differing biomes and climates may be represented within the same pyrome, implying that pathways of change in future fire regimes in response to changes in climate and human activity may be difficult to predict.
Conflict of interest statement
Conflict of interest statement: David Bowman was supervisor and collaborator of C.E.R.L. and is a current collaborator with R.A.B.; William Bond is a current collaborator of S.A. and C.E.R.L.; and Simon Levin is a current collaborator of S.A.
Figures
References
-
- Gill AM. Fire and the Australian flora: A review. Aust For. 1975;38:4–25.
-
- Bond WJ, Keeley JE. Fire as a global ‘herbivore’: The ecology and evolution of flammable ecosystems. Trends Ecol Evol. 2005;20(7):387–394. - PubMed
-
- van der Werf G, et al. Global fire emissions and the contribution of deforestation, savanna, forest, agricultural, and peat fires (1997–2009) Atmos Chem Phys Discuss. 2010;10:16153–16230.
-
- Moritz MA. Spatiotemporal analysis of controls on shrubland fire regimes: Age dependency and fire hazard. Ecology. 2003;84:351–361.
-
- Keeley JE, Fotheringham CJ, Morais M. Reexamining fire suppression impacts on brushland fire regimes. Science. 1999;284(5421):1829–1832. - PubMed
Publication types
MeSH terms
LinkOut - more resources
Full Text Sources
Other Literature Sources
