

Cumulative incidence of cancer after solid organ transplantation
- PMID: 23559438
- PMCID: PMC4241498
- DOI: 10.1002/cncr.28043
Cumulative incidence of cancer after solid organ transplantation
Abstract
Background: Solid organ transplantation recipients have elevated cancer incidence. Estimates of absolute cancer risk after transplantation can inform prevention and screening.
Methods: The Transplant Cancer Match Study links the US transplantation registry with 14 state/regional cancer registries. The authors used nonparametric competing risk methods to estimate the cumulative incidence of cancer after transplantation for 2 periods (1987-1999 and 2000-2008). For recipients from 2000 to 2008, the 5-year cumulative incidence, stratified by organ, sex, and age at transplantation, was estimated for 6 preventable or screen-detectable cancers. For comparison, the 5-year cumulative incidence was calculated for the same cancers in the general population at representative ages using Surveillance, Epidemiology, and End Results data.
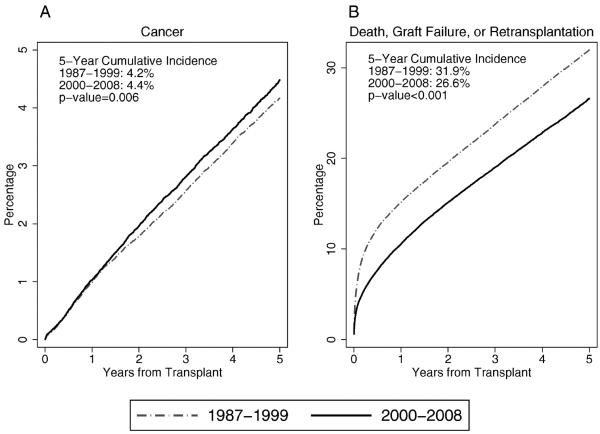
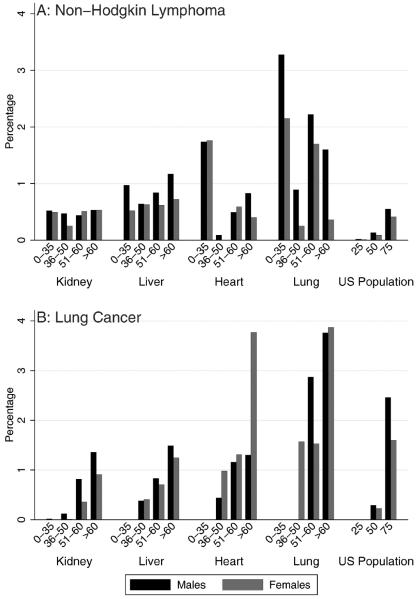
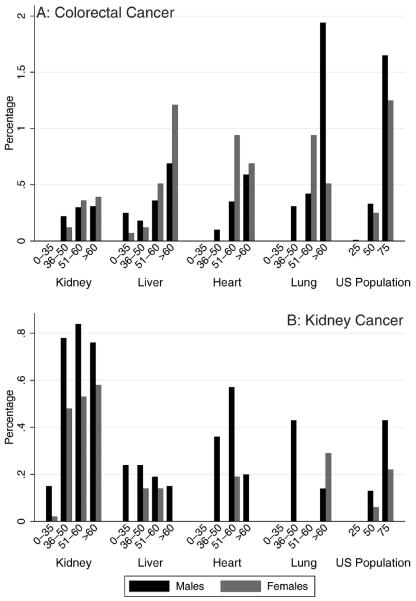
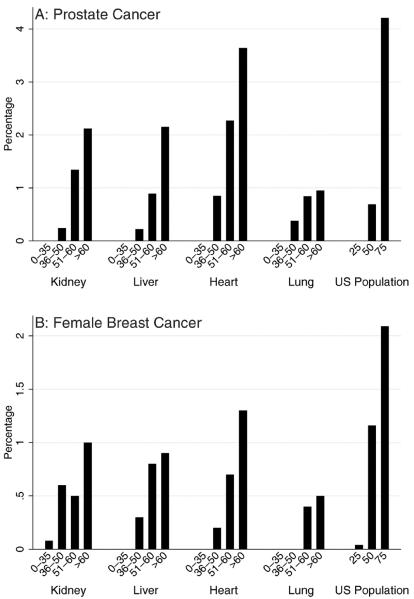
Results: Among 164,156 recipients, 8520 incident cancers were identified. The absolute cancer risk was slightly higher for recipients during the period from 2000 to 2008 than during the period from 1987 to 1999 (5-year cumulative incidence: 4.4% vs. 4.2%; P = .006); this difference arose from the decreasing risk of competing events (5-year cumulative incidence of death, graft failure, or retransplantation: 26.6% vs. 31.9%; P < .001). From 2000 to 2008, the 5-year cumulative incidence of non-Hodgkin lymphoma was highest at extremes of age, especially in thoracic organ recipients (ages 0-34 years: range, 1.74%-3.28%; aged >50 years; range, 0.36%-2.22%). For recipients aged >50 years, the 5-year cumulative incidence was higher for colorectal cancer (range, 0.33%-1.94%) than for the general population at the recommended screening age (aged 50 years: range, 0.25%-0.33%). For recipients aged >50 years, the 5-year cumulative incidence was high for lung cancer among thoracic organ recipients (range, 1.16%-3.87%) and for kidney cancer among kidney recipients (range, 0.53%-0.84%). The 5-year cumulative incidence for prostate cancer and breast cancer was similar or lower in transplantation recipients than at the recommended ages of screening in the general population.
Conclusions: Subgroups of transplantation recipients have a high absolute risk of some cancers and may benefit from targeted prevention or screening.
Copyright © 2013 American Cancer Society.
Figures
Comment in
-
Re: Cumulative incidence of cancer after solid organ transplantation.J Urol. 2014 Apr;191(4):948-9. doi: 10.1016/j.juro.2014.01.061. Epub 2014 Jan 17. J Urol. 2014. PMID: 24703111 No abstract available.
References
-
- Grulich AE, van Leeuwen MT, Falster MO, Vajdic CM. Incidence of cancers in people with HIV/AIDS compared with immunosup-pressed transplant recipients: a meta-analysis. Lancet. 2007;370:59–67. - PubMed
-
- Department of Health and Human Services. Health Resources and Services Administration . 2008 Annual Report of the US Procurement and Transplantation Network and the Scientific Registry of Transplant Recipients: Transplant Data 1998–2007. US Department of Health and Human Services, Health Resources and Services Administration, Healthcare Systems Bureau, Division of Transplantation; Rockville, MD: 2008.
-
- Pintilie M. Competing Risks: A Practical Perspective. John Wiley & Sons, Ltd.; Chichester, United Kingdom: 2007.
-
- Varadhan R, Weiss CO, Segal JB, Wu AW, Scharfstein D, Boyd C. Evaluating health outcomes in the presence of competing risks: a review of statistical methods and clinical applications. Med Care. 2010;48(6 suppl):S96–S105. - PubMed
Publication types
MeSH terms
Grants and funding
- 5U58DP000824-04/DP/NCCDPHP CDC HHS/United States
- N01-PC-35,142/PC/NCI NIH HHS/United States
- 5U58DP000812-03/DP/NCCDPHP CDC HHS/United States
- U58 DP000848-04/DP/NCCDPHP CDC HHS/United States
- 5U58DP000817-05/DP/NCCDPHP CDC HHS/United States
- T32CA126607/CA/NCI NIH HHS/United States
- U58 DP000807/DP/NCCDPHP CDC HHS/United States
- N01-PC-35,137/PC/NCI NIH HHS/United States
- HHSN261201000027C/CA/NCI NIH HHS/United States
- U58 DP000832/DP/NCCDPHP CDC HHS/United States
- U58 DP000824/DP/NCCDPHP CDC HHS/United States
- N01-PC-35,139/PC/NCI NIH HHS/United States
- 5U58/DP000808-05/DP/NCCDPHP CDC HHS/United States
- U58 DP000805/DP/NCCDPHP CDC HHS/United States
- U58 DP000817/DP/NCCDPHP CDC HHS/United States
- N01-PC-2012-00,027/PC/NCI NIH HHS/United States
- U58DP000832/DP/NCCDPHP CDC HHS/United States
- 1U58 DP000807-01/DP/NCCDPHP CDC HHS/United States
- U58 DP000808/DP/NCCDPHP CDC HHS/United States
- T32 CA126607/CA/NCI NIH HHS/United States
- U58 DP000848/DP/NCCDPHP CDC HHS/United States
- Z01 CP010150/ImNIH/Intramural NIH HHS/United States
- 5658DP 000805-04/DP/NCCDPHP CDC HHS/United States
- N01-PC-35,143/PC/NCI NIH HHS/United States
LinkOut - more resources
Full Text Sources
Other Literature Sources
Medical
