

Quantitative multiparametric MRI of ovarian cancer
- PMID: 23559453
- PMCID: PMC3706562
- DOI: 10.1002/jmri.24119
Quantitative multiparametric MRI of ovarian cancer
Abstract
Purpose: To identify parameters associated with ovarian malignancy using multiparametric quantitative magnetic resonance imaging (MRI).
Materials and methods: After Institutional Review Board (IRB) approval, women with ovarian masses underwent preoperative imaging with 3 T MRI. Dynamic contrast-enhanced (DCE)-MRI with pharmacokinetic modeling, quantitative T2 mapping, and diffusion-weighted imaging with quantitative mapping of the water diffusion parameters were performed. Ovarian masses had one or more discreet regions of interest, categorized as cystic or solid, and histologically diagnosed as benign or malignant. Mean region of interest (ROI) values were compared between benign and malignant masses using generalized estimating equations. In addition, we compared classification accuracy for the mean ROI value to a combination of histogram characteristics (standard deviation, skewness, and kurtosis) from T2 map ROIs using logistic regression and ROC curve. The significance level was P = 0.05.
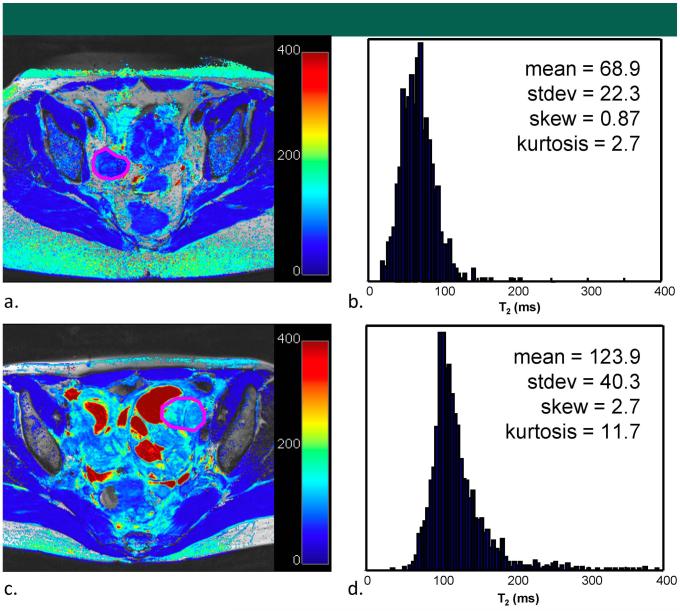
Results: Several DCE-MRI parameters differentiated solid benign from malignant masses. Toft's rate constant (kep ) was significantly higher in malignant masses (P < 0.001), as well as quantitative T2 values (P = 0.003), and signal intensity on T2 weighted imaging (P = 0.008). A linear combination of the mean, standard deviation, skewness, and kurtosis of T2 within solid regions (area under the curve [AUC] 0.90) provided better classification accuracy than the mean of T2 alone (AUC 0.81).
Conclusion: Quantitative parameters from DCE-MRI and T2 mapping can differentiate benign from malignant ovarian masses.
Keywords: investigative techniques; magnetic resonance imaging; methods; neoplasms; ovary.
Copyright © 2013 Wiley Periodicals, Inc.
Figures


References
-
- American, Cancer Society . Cancer Facts and Figures 2009. American Cancer Society; Atlanta: 2009.
-
- Munkarah A, Chatterjee M, Tainsky M. Update on ovarian cancer screening. Curr Opin Obstet Gynecol. 2007;19:22–26. - PubMed
-
- Menon U, Gentry-Maharaj A, Hallett R, et al. Sensitivity and specificity of multimodal and ultrasound screening for ovarian cancer, and stage distribution of detected cancers: results of the prevalence screen of the UK Collaborative Trial of Ovarian Cancer Screening (UKCTOCS). Lancet Oncol. 2009;10:327–340. - PubMed
-
- Buy JN, Ghossain MA, Hugol D, et al. Characterization of adnexal masses: combination of color Doppler and conventional sonography compared with spectral Doppler analysis alone and conventional sonography alone. AJR. 1996;166:385–393. - PubMed
-
- Stein SM, Laifer-Narin S, Johnson MB, et al. Differentiation of benign and malignant adnexal masses: relative value of gray-scale, color Doppler, and spectral Doppler sonography. AJR. 1995;164:381–386. - PubMed
Publication types
MeSH terms
Grants and funding
LinkOut - more resources
Full Text Sources
Other Literature Sources
Medical
