

Nerves projecting from the intrinsic cardiac ganglia of the pulmonary veins modulate sinoatrial node pacemaker function
- PMID: 23559611
- PMCID: PMC3718320
- DOI: 10.1093/cvr/cvt081
Nerves projecting from the intrinsic cardiac ganglia of the pulmonary veins modulate sinoatrial node pacemaker function
Abstract
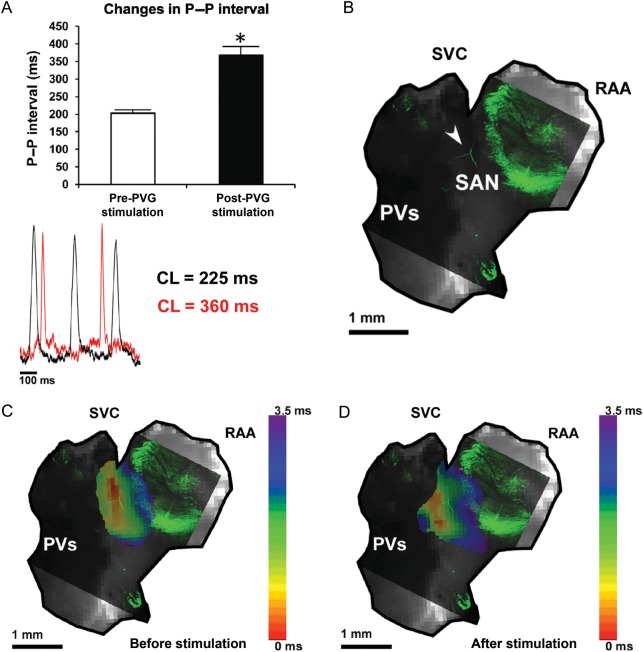
Aims: Pulmonary vein ganglia (PVG) are targets for atrial fibrillation ablation. However, the functional relevance of PVG to the normal heart rhythm remains unclear. Our aim was to investigate whether PVG can modulate sinoatrial node (SAN) function.
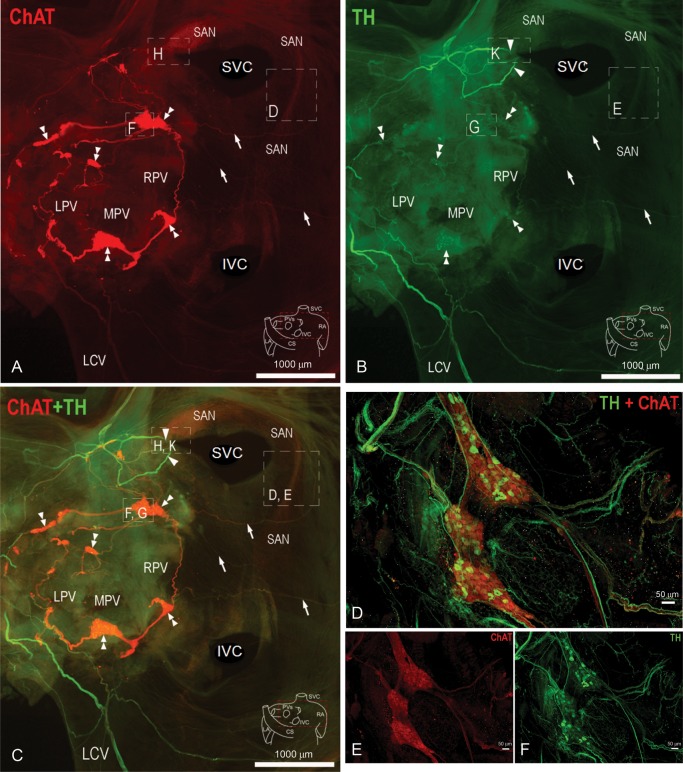
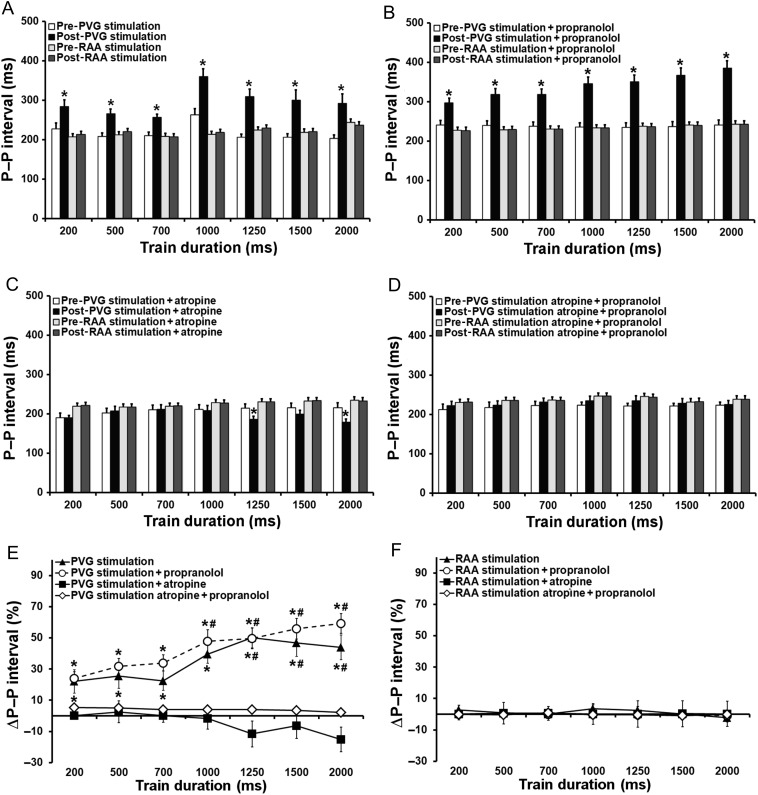
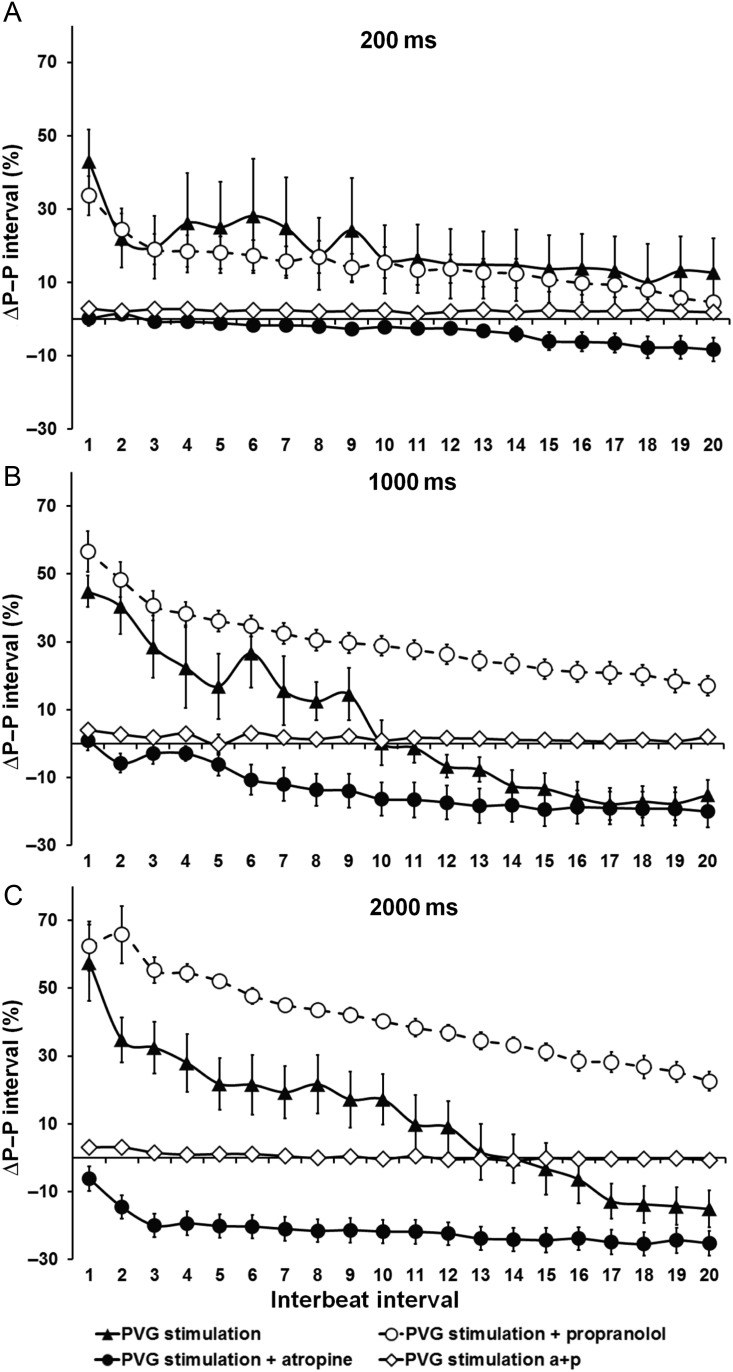
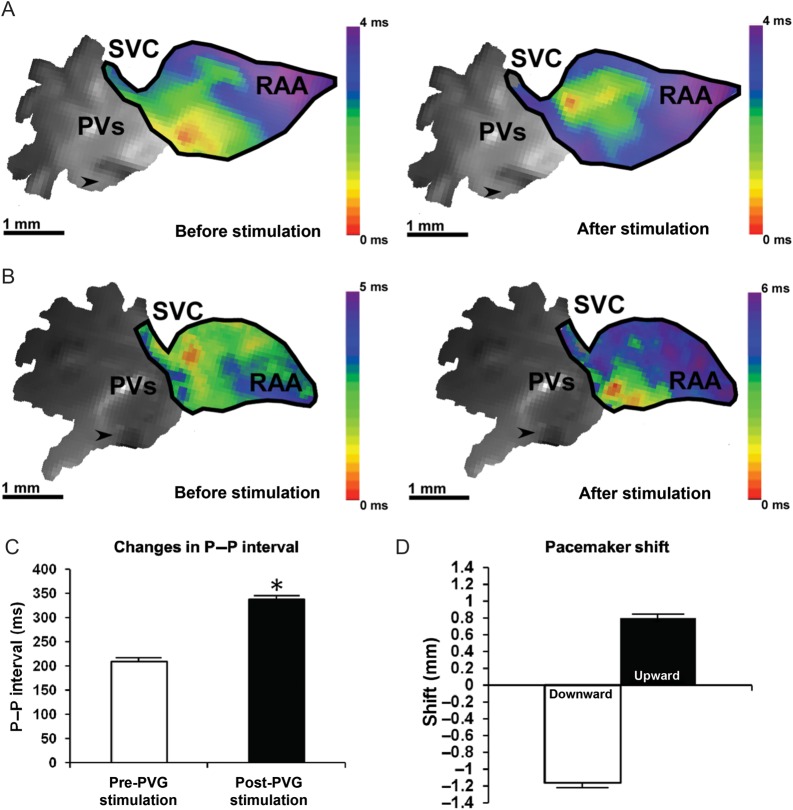
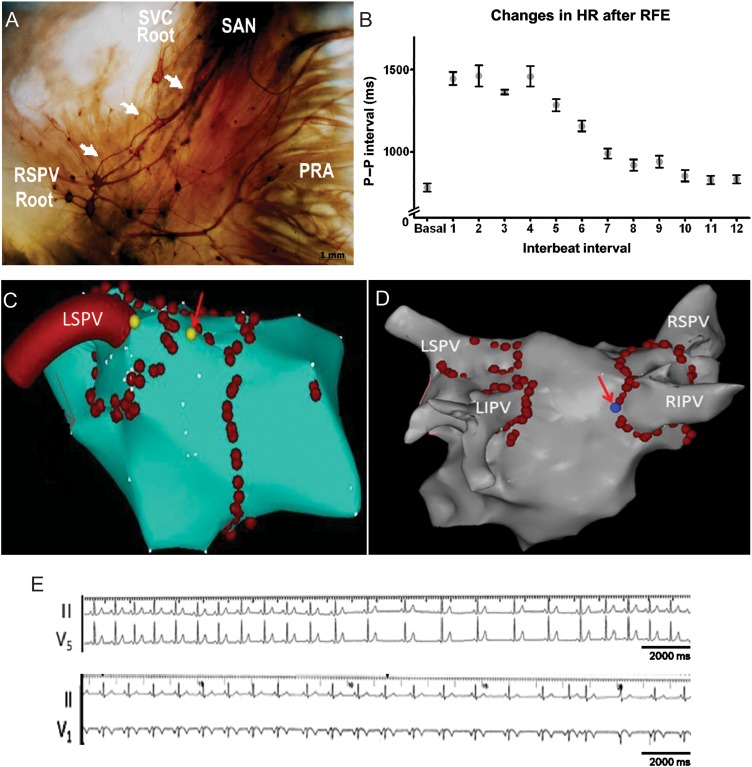
Methods and results: Forty-nine C57BL and seven Connexin40+/EGFP mice were studied. We used tyrosine-hydroxylase (TH) and choline-acetyltransferase immunofluorescence labelling to characterize adrenergic and cholinergic neural elements. PVG projected postganglionic nerves to the SAN, which entered the SAN as an extensive, mesh-like neural network. PVG neurones were adrenergic, cholinergic, and biphenotypic. Histochemical characterization of two human embryonic hearts showed similarities between mouse and human neuroanatomy: direct neural communications between PVG and SAN. In Langendorff perfused mouse hearts, PVG were stimulated using 200-2000 ms trains of pulses (300 μs, 400 µA, 200 Hz). PVG stimulation caused an initial heart rate (HR) slowing (36 ± 9%) followed by acceleration. PVG stimulation in the presence of propranolol caused HR slowing (43 ± 13%) that was sustained over 20 beats. PVG stimulation with atropine progressively increased HR. Time-course effects were enhanced with 1000 and 2000 ms trains (P < 0.05 vs. 200 ms). In optical mapping, PVG stimulation shifted the origin of SAN discharges. In five paroxysmal AF patients undergoing pulmonary vein ablation, application of radiofrequency energy to the PVG area during sinus rhythm produced a decrease in HR similar to that observed in isolated mouse hearts.
Conclusion: PVG have functional and anatomical biphenotypic characteristics. They can have significant effects on the electrophysiological control of the SAN.
Keywords: Intrinsic cardiac ganglia; Pulmonary veins; Sinoatrial node.
Figures
Comment in
-
How the pulmonary veins 'talk' to the sinoatrial node: new insights into an old mystery.Cardiovasc Res. 2013 Aug 1;99(3):380-1. doi: 10.1093/cvr/cvt175. Epub 2013 Jun 28. Cardiovasc Res. 2013. PMID: 23812416 No abstract available.
Similar articles
-
Pulmonary Vein Ganglia Are Remodeled in the Diabetic Heart.J Am Heart Assoc. 2018 Dec 4;7(23):e008919. doi: 10.1161/JAHA.118.008919. J Am Heart Assoc. 2018. PMID: 30511897 Free PMC article.
-
Electrophysiological mapping of embryonic mouse hearts: mechanisms for developmental pacemaker switch and internodal conduction pathway.J Cardiovasc Electrophysiol. 2012 Mar;23(3):309-18. doi: 10.1111/j.1540-8167.2011.02191.x. Epub 2011 Oct 10. J Cardiovasc Electrophysiol. 2012. PMID: 21985309 Free PMC article.
-
Interactive atrial neural network: Determining the connections between ganglionated plexi.Heart Rhythm. 2007 Jan;4(1):56-63. doi: 10.1016/j.hrthm.2006.09.020. Epub 2006 Sep 23. Heart Rhythm. 2007. PMID: 17198991
-
Heart Failure Differentially Modulates Natural (Sinoatrial Node) and Ectopic (Pulmonary Veins) Pacemakers: Mechanism and Therapeutic Implication for Atrial Fibrillation.Int J Mol Sci. 2019 Jun 30;20(13):3224. doi: 10.3390/ijms20133224. Int J Mol Sci. 2019. PMID: 31262061 Free PMC article. Review.
-
Canine and human sinoatrial node: differences and similarities in the structure, function, molecular profiles, and arrhythmia.J Vet Cardiol. 2019 Apr;22:2-19. doi: 10.1016/j.jvc.2018.10.004. Epub 2018 Dec 14. J Vet Cardiol. 2019. PMID: 30559056 Free PMC article. Review.
Cited by
-
Impaired signaling intrinsic to sinoatrial node pacemaker cells affects heart rate variability during cardiac disease.J Clin Trials. 2014 Mar;4(1):152. doi: 10.4172/2167-0870.1000152. J Clin Trials. 2014. PMID: 26251764 Free PMC article.
-
The Ionotropic P2X4 Receptor has Unique Properties in the Heart by Mediating the Negative Chronotropic Effect of ATP While Increasing the Ventricular Inotropy.Front Pharmacol. 2019 Sep 24;10:1103. doi: 10.3389/fphar.2019.01103. eCollection 2019. Front Pharmacol. 2019. PMID: 31611793 Free PMC article.
-
Molecular and cellular neurocardiology in heart disease.J Physiol. 2025 Mar;603(7):1689-1728. doi: 10.1113/JP284739. Epub 2024 May 22. J Physiol. 2025. PMID: 38778747 Review.
-
Modifications of short-term intrinsic pacemaker variability in diet-induced metabolic syndrome: a study on isolated rabbit heart.J Physiol Biochem. 2019 Jun;75(2):173-183. doi: 10.1007/s13105-019-00667-7. Epub 2019 Mar 18. J Physiol Biochem. 2019. PMID: 30887428
-
Molecular and cellular neurocardiology: development, and cellular and molecular adaptations to heart disease.J Physiol. 2016 Jul 15;594(14):3853-75. doi: 10.1113/JP271840. Epub 2016 Jun 17. J Physiol. 2016. PMID: 27060296 Free PMC article. Review.
References
-
- Johnson TA, Gray AL, Lauenstein JM, Newton SS, Massari VJ. Parasympathetic control of the heart. I. An interventriculo-septal ganglion is the major source of the vagal intracardiac innervation of the ventricles. J Appl Physiol. 2004;96:2265–2272. doi:10.1152/japplphysiol.00620.2003. - DOI - PubMed
-
- Rysevaite K, Saburkina I, Pauziene N, Noujaim SF, Jalife J, Pauza DH. Morphologic pattern of the intrinsic ganglionated nerve plexus in mouse heart. Heart Rhythm. 2011;8:448–454. doi:10.1016/j.hrthm.2010.11.019. - DOI - PMC - PubMed
-
- Yuan BX, Ardell JL, Hopkins DA, Armour JA. Differential cardiac responses induced by nicotine sensitive canine atrial and ventricular neurones. Cardiovasc Res. 1993;27:760–769. doi:10.1093/cvr/27.5.760. - DOI - PubMed
-
- Rysevaite K, Saburkina I, Pauziene N, Vaitkevicius R, Noujaim SF, Jalife J, et al. Immunohistochemical characterization of the intrinsic cardiac neural plexus in whole-mount mouse heart preparations. Heart Rhythm. 2011;8:731–738. doi:10.1016/j.hrthm.2011.01.013. - DOI - PMC - PubMed
-
- Pauza DH, Pauziene N, Pakeltyte G, Stropus R. Comparative quantitative study of the intrinsic cardiac ganglia and neurons in the rat, guinea pig, dog and human as revealed by histochemical staining for acetylcholinesterase. Ann Anat. 2002;184:125–136. doi:10.1016/S0940-9602(02)80005-X. - DOI - PubMed
Publication types
MeSH terms
Grants and funding
LinkOut - more resources
Full Text Sources
Other Literature Sources
