

Airflow dynamics of human jets: sneezing and breathing - potential sources of infectious aerosols
- PMID: 23560060
- PMCID: PMC3613375
- DOI: 10.1371/journal.pone.0059970
Airflow dynamics of human jets: sneezing and breathing - potential sources of infectious aerosols
Abstract
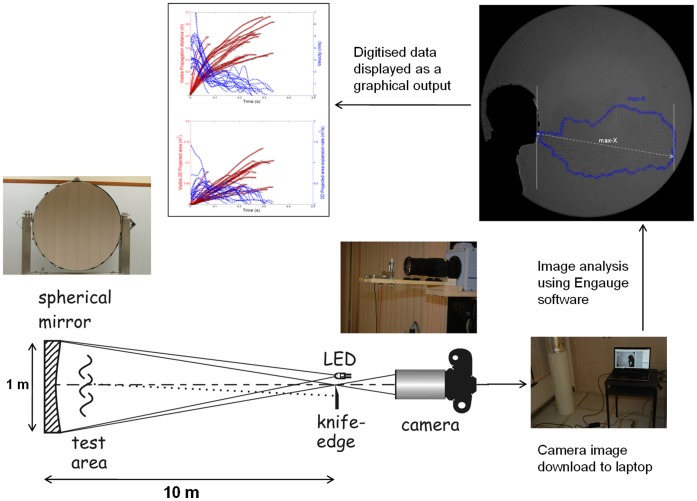
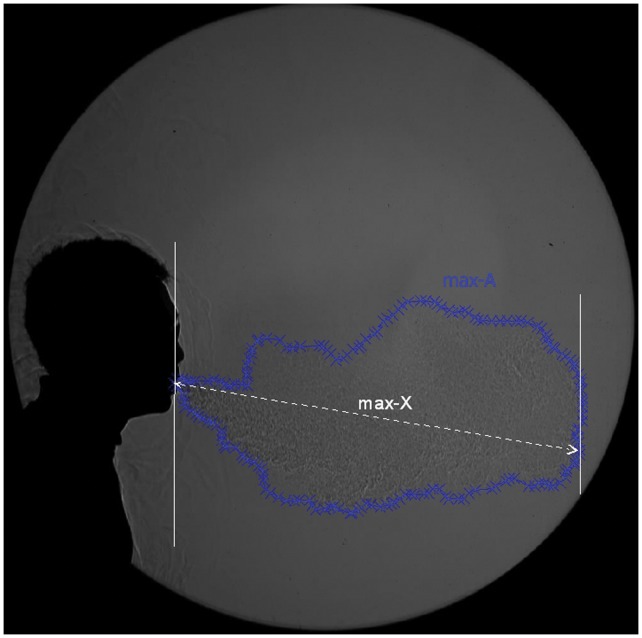
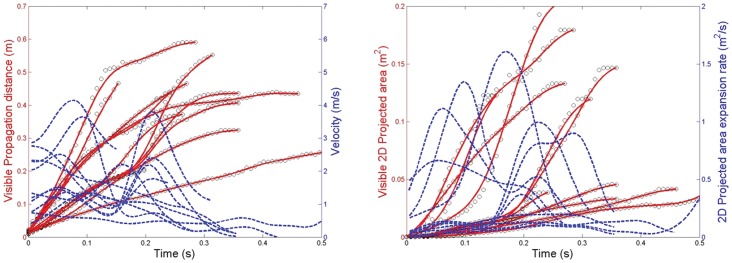
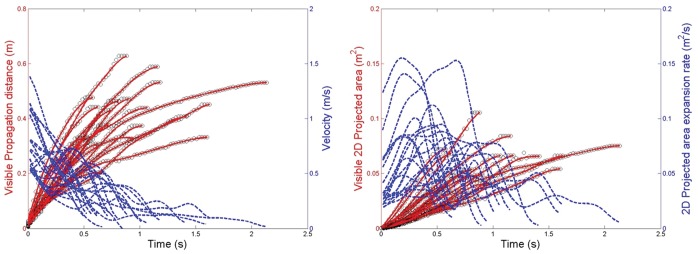
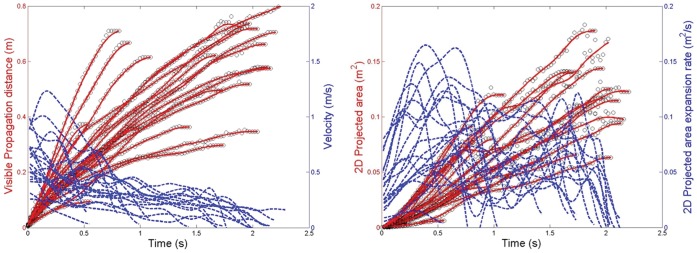
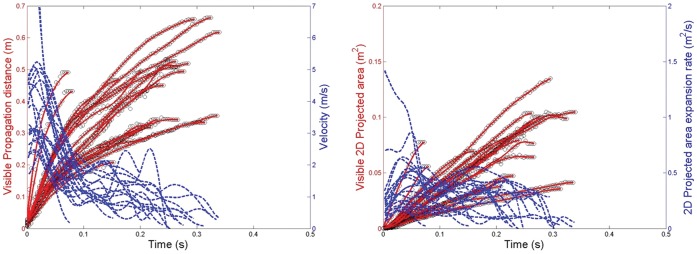
Natural human exhalation flows such as coughing, sneezing and breathing can be considered as 'jet-like' airflows in the sense that they are produced from a single source in a single exhalation effort, with a relatively symmetrical, conical geometry. Although coughing and sneezing have garnered much attention as potential, explosive sources of infectious aerosols, these are relatively rare events during daily life, whereas breathing is necessary for life and is performed continuously. Real-time shadowgraph imaging was used to visualise and capture high-speed images of healthy volunteers sneezing and breathing (through the nose - nasally, and through the mouth - orally). Six volunteers, who were able to respond to the pepper sneeze stimulus, were recruited for the sneezing experiments (2 women: 27.5±6.36 years; 4 men: 29.25±10.53 years). The maximum visible distance over which the sneeze plumes (or puffs) travelled was 0.6 m, the maximum sneeze velocity derived from these measured distances was 4.5 m/s. The maximum 2-dimensional (2-D) area of dissemination of these sneezes was 0.2 m(2). The corresponding derived parameter, the maximum 2-D area expansion rate of these sneezes was 2 m(2)/s. For nasal breathing, the maximum propagation distance and derived velocity were 0.6 m and 1.4 m/s, respectively. The maximum 2-D area of dissemination and derived expansion rate were 0.11 m(2) and 0.16 m(2)/s, respectively. Similarly, for mouth breathing, the maximum propagation distance and derived velocity were 0.8 m and 1.3 m/s, respectively. The maximum 2-D area of dissemination and derived expansion rate were 0.18 m(2) and 0.17 m(2)/s, respectively. Surprisingly, a comparison of the maximum exit velocities of sneezing reported here with those obtained from coughing (published previously) demonstrated that they are relatively similar, and not extremely high. This is in contrast with some earlier estimates of sneeze velocities, and some reasons for this difference are discussed.
Conflict of interest statement
Figures
Similar articles
-
Airflow dynamics of coughing in healthy human volunteers by shadowgraph imaging: an aid to aerosol infection control.PLoS One. 2012;7(4):e34818. doi: 10.1371/journal.pone.0034818. Epub 2012 Apr 20. PLoS One. 2012. PMID: 22536332 Free PMC article.
-
A new methodology for studying dynamics of aerosol particles in sneeze and cough using a digital high-vision, high-speed video system and vector analyses.PLoS One. 2013 Nov 27;8(11):e80244. doi: 10.1371/journal.pone.0080244. eCollection 2013. PLoS One. 2013. PMID: 24312206 Free PMC article.
-
Computer simulations of pressure and velocity fields in a human upper airway during sneezing.Comput Biol Med. 2016 Apr 1;71:115-27. doi: 10.1016/j.compbiomed.2016.01.022. Epub 2016 Feb 2. Comput Biol Med. 2016. PMID: 26914240
-
Sneeze reflex: facts and fiction.Ther Adv Respir Dis. 2009 Jun;3(3):131-41. doi: 10.1177/1753465809340571. Epub 2009 Jul 17. Ther Adv Respir Dis. 2009. PMID: 19617285 Review.
-
A review on the transmission of COVID-19 based on cough/sneeze/breath flows.Eur Phys J Plus. 2022;137(1):1. doi: 10.1140/epjp/s13360-021-02162-9. Epub 2021 Dec 10. Eur Phys J Plus. 2022. PMID: 34909366 Free PMC article. Review.
Cited by
-
Universal trends in human cough airflows at large distances.Phys Fluids (1994). 2020 Aug 1;32(8):081905. doi: 10.1063/5.0021666. Epub 2020 Aug 25. Phys Fluids (1994). 2020. PMID: 32904942 Free PMC article.
-
Simplified models of aerosol collision and deposition for disease transmission.Sci Rep. 2023 Nov 27;13(1):20778. doi: 10.1038/s41598-023-48053-0. Sci Rep. 2023. PMID: 38012339 Free PMC article.
-
Virus transport and infection evaluation in a passenger elevator with a COVID-19 patient.Indoor Air. 2022 Oct;32(10):e13125. doi: 10.1111/ina.13125. Indoor Air. 2022. PMID: 36305056 Free PMC article.
-
International survey of ophthalmic anaesthesia service provision, protection of anaesthesia providers and patients during COVID-19 pandemic: a wake-up call.Eye (Lond). 2023 Feb;37(3):548-553. doi: 10.1038/s41433-022-01979-7. Epub 2022 Feb 26. Eye (Lond). 2023. PMID: 35220400 Free PMC article.
-
Technical note: Impact of face covering on aerosol transport patterns during coughing and sneezing.J Aerosol Sci. 2021 Nov;158:105847. doi: 10.1016/j.jaerosci.2021.105847. Epub 2021 Jul 15. J Aerosol Sci. 2021. PMID: 34305164 Free PMC article.
References
Publication types
MeSH terms
Substances
LinkOut - more resources
Full Text Sources
Other Literature Sources
