

Remodeling of oxidative energy metabolism by galactose improves glucose handling and metabolic switching in human skeletal muscle cells
- PMID: 23560061
- PMCID: PMC3613401
- DOI: 10.1371/journal.pone.0059972
Remodeling of oxidative energy metabolism by galactose improves glucose handling and metabolic switching in human skeletal muscle cells
Abstract
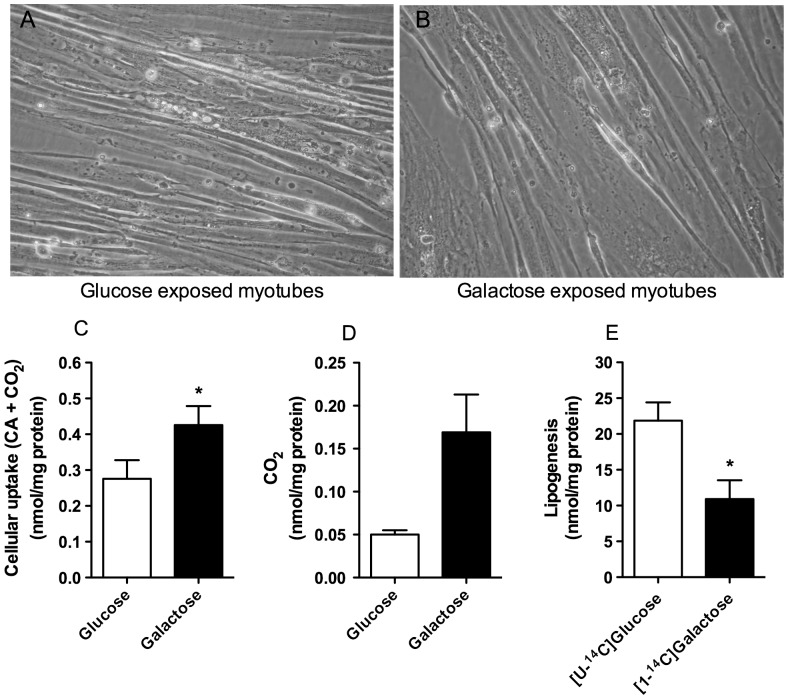
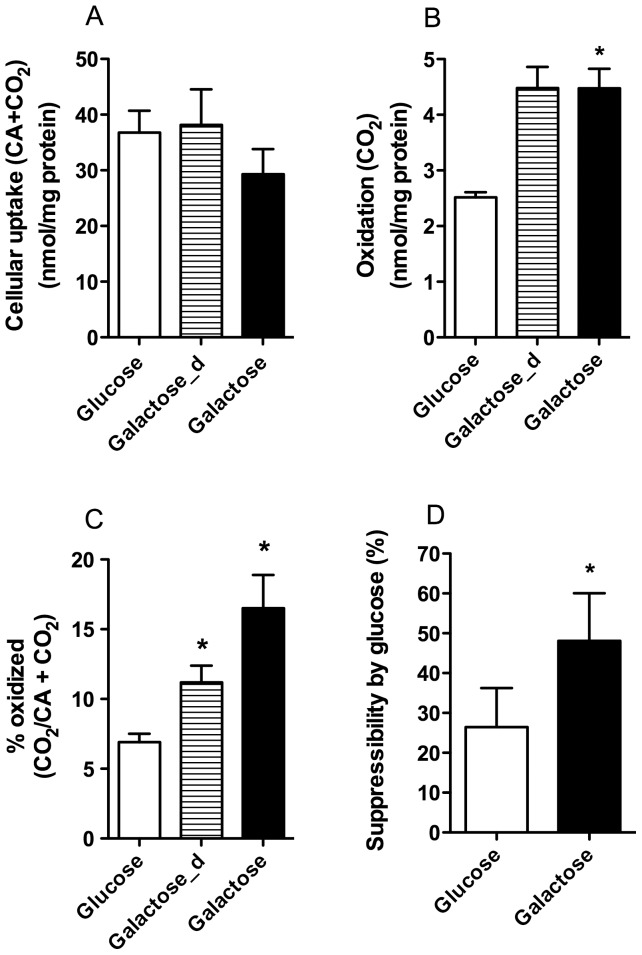
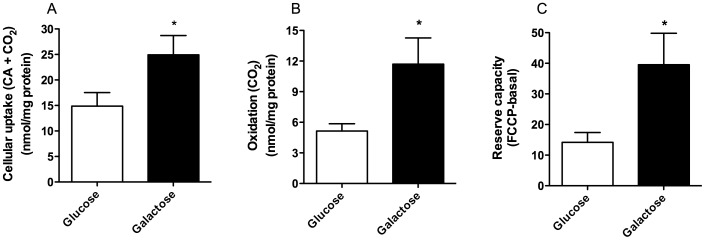
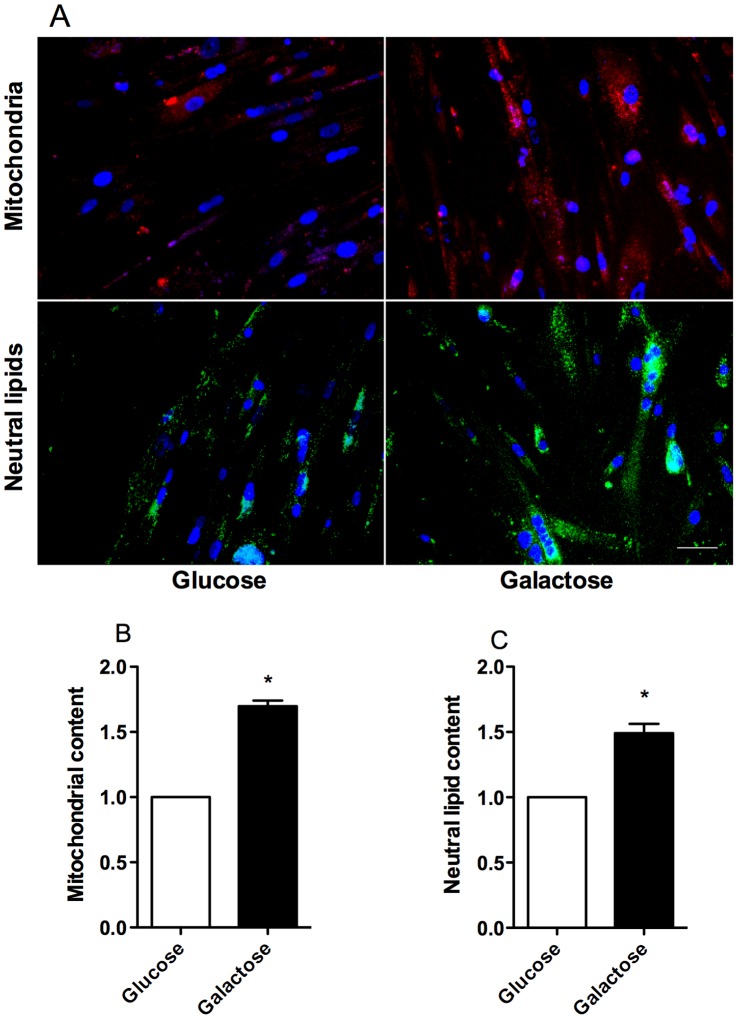
Cultured human myotubes have a low mitochondrial oxidative potential. This study aims to remodel energy metabolism in myotubes by replacing glucose with galactose during growth and differentiation to ultimately examine the consequences for fatty acid and glucose metabolism. Exposure to galactose showed an increased [(14)C]oleic acid oxidation, whereas cellular uptake of oleic acid uptake was unchanged. On the other hand, both cellular uptake and oxidation of [(14)C]glucose increased in myotubes exposed to galactose. In the presence of the mitochondrial uncoupler carbonylcyanide p-trifluormethoxy-phenylhydrazone (FCCP) the reserve capacity for glucose oxidation was increased in cells grown with galactose. Staining and live imaging of the cells showed that myotubes exposed to galactose had a significant increase in mitochondrial and neutral lipid content. Suppressibility of fatty acid oxidation by acute addition of glucose was increased compared to cells grown in presence of glucose. In summary, we show that cells grown in galactose were more oxidative, had increased oxidative capacity and higher mitochondrial content, and showed an increased glucose handling. Interestingly, cells exposed to galactose showed an increased suppressibility of fatty acid metabolism. Thus, galactose improved glucose metabolism and metabolic switching of myotubes, representing a cell model that may be valuable for metabolic studies related to insulin resistance and disorders involving mitochondrial impairments.
Conflict of interest statement
Figures
Similar articles
-
Chronic hyperglycemia reduces substrate oxidation and impairs metabolic switching of human myotubes.Biochim Biophys Acta. 2011 Jan;1812(1):94-105. doi: 10.1016/j.bbadis.2010.09.014. Epub 2010 Oct 1. Biochim Biophys Acta. 2011. PMID: 20888904
-
Galactose enhances oxidative metabolism and reveals mitochondrial dysfunction in human primary muscle cells.PLoS One. 2011;6(12):e28536. doi: 10.1371/journal.pone.0028536. Epub 2011 Dec 15. PLoS One. 2011. PMID: 22194845 Free PMC article.
-
Metabolic switching of human myotubes is improved by n-3 fatty acids.J Lipid Res. 2010 Aug;51(8):2090-104. doi: 10.1194/jlr.M003319. Epub 2010 Apr 2. J Lipid Res. 2010. PMID: 20363834 Free PMC article.
-
Metabolic switching of human skeletal muscle cells in vitro.Prostaglandins Leukot Essent Fatty Acids. 2011 Nov;85(5):227-34. doi: 10.1016/j.plefa.2011.04.017. Epub 2011 May 5. Prostaglandins Leukot Essent Fatty Acids. 2011. PMID: 21549583 Review.
-
Skeletal muscle energy metabolism in obesity.Obesity (Silver Spring). 2021 Oct;29(10):1582-1595. doi: 10.1002/oby.23227. Epub 2021 Aug 31. Obesity (Silver Spring). 2021. PMID: 34464025 Review.
Cited by
-
Spermine and spermidine reversed age-related cardiac deterioration in rats.Oncotarget. 2017 May 31;8(39):64793-64808. doi: 10.18632/oncotarget.18334. eCollection 2017 Sep 12. Oncotarget. 2017. PMID: 29029392 Free PMC article.
-
Glycolysis and oxidative phosphorylation are essential for purinergic receptor-mediated angiogenic responses in vasa vasorum endothelial cells.Am J Physiol Cell Physiol. 2017 Jan 1;312(1):C56-C70. doi: 10.1152/ajpcell.00250.2016. Epub 2016 Nov 16. Am J Physiol Cell Physiol. 2017. PMID: 27856430 Free PMC article.
-
Spinochrome D Attenuates Doxorubicin-Induced Cardiomyocyte Death via Improving Glutathione Metabolism and Attenuating Oxidative Stress.Mar Drugs. 2018 Dec 20;17(1):2. doi: 10.3390/md17010002. Mar Drugs. 2018. PMID: 30577438 Free PMC article.
-
Sweet Science: Exploring the Impact of Fructose and Glucose on Brown Adipocyte Differentiation Using Optical Diffraction Tomography.J Cell Biochem. 2025 Jun;126(6):e70052. doi: 10.1002/jcb.70052. J Cell Biochem. 2025. PMID: 40583297 Free PMC article.
-
Integrated transcriptomics and metabolomics analysis reveals the biomolecular mechanisms associated to the antitumoral potential of a novel silver-based core@shell nanosystem.Mikrochim Acta. 2023 Mar 13;190(4):132. doi: 10.1007/s00604-023-05712-3. Mikrochim Acta. 2023. PMID: 36914921 Free PMC article.
References
-
- Zuurveld JG, Oosterhof A, Veerkamp JH, van Moerkerk HT (1985) Oxidative metabolism of cultured human skeletal muscle cells in comparison with biopsy material. Biochim Biophys Acta 844: 1–8. - PubMed
-
- Gaster M, Petersen I, Hojlund K, Poulsen P, Beck-Nielsen H (2002) The diabetic phenotype is conserved in myotubes established from diabetic subjects: evidence for primary defects in glucose transport and glycogen synthase activity. Diabetes 51: 921–927. - PubMed
-
- Gaster M, Rustan AC, Aas V, Beck-Nielsen H (2004) Reduced lipid oxidation in skeletal muscle from type 2 diabetic subjects may be of genetic origin: evidence from cultured myotubes. Diabetes 53: 542–548. - PubMed
-
- Jackson S, Bagstaff SM, Lynn S, Yeaman SJ, Turnbull DM, et al. (2000) Decreased insulin responsiveness of glucose uptake in cultured human skeletal muscle cells from insulin-resistant nondiabetic relatives of type 2 diabetic families. Diabetes 49: 1169–1177. - PubMed
Publication types
MeSH terms
Substances
LinkOut - more resources
Full Text Sources
Other Literature Sources
