

Tertiary origin and pleistocene diversification of dragon blood tree (Dracaena cambodiana-Asparagaceae) populations in the Asian tropical forests
- PMID: 23560070
- PMCID: PMC3613351
- DOI: 10.1371/journal.pone.0060102
Tertiary origin and pleistocene diversification of dragon blood tree (Dracaena cambodiana-Asparagaceae) populations in the Asian tropical forests
Erratum in
- PLoS One. 2013;8(6). doi:10.1371/annotation/e99f332e-5464-451a-9d46-e09a6bb1f239
Abstract
Background: The origin of extraordinarily rich biodiversity in tropical forests is often attributed to evolution under stable climatic conditions over a long period or to climatic fluctuations during the recent Quaternary period. Here, we test these two hypotheses using Dracaena cambodiana, a plant species distributed in paleotropical forests.
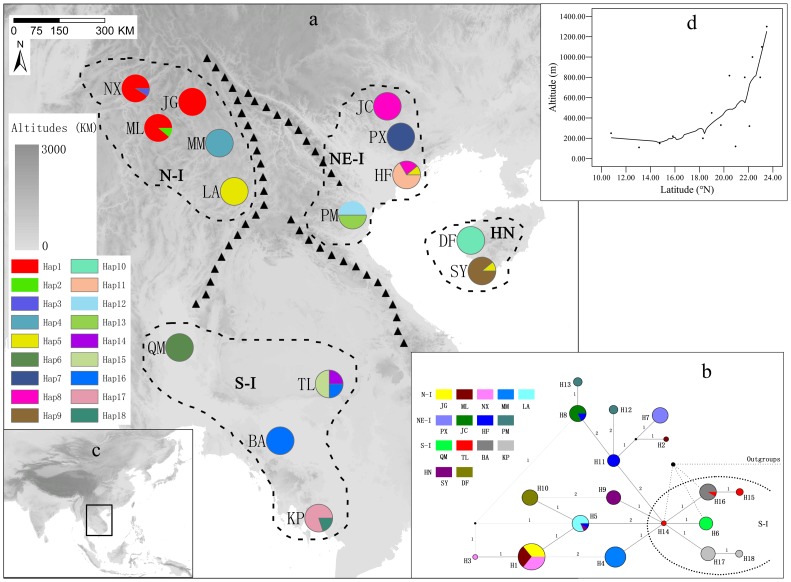
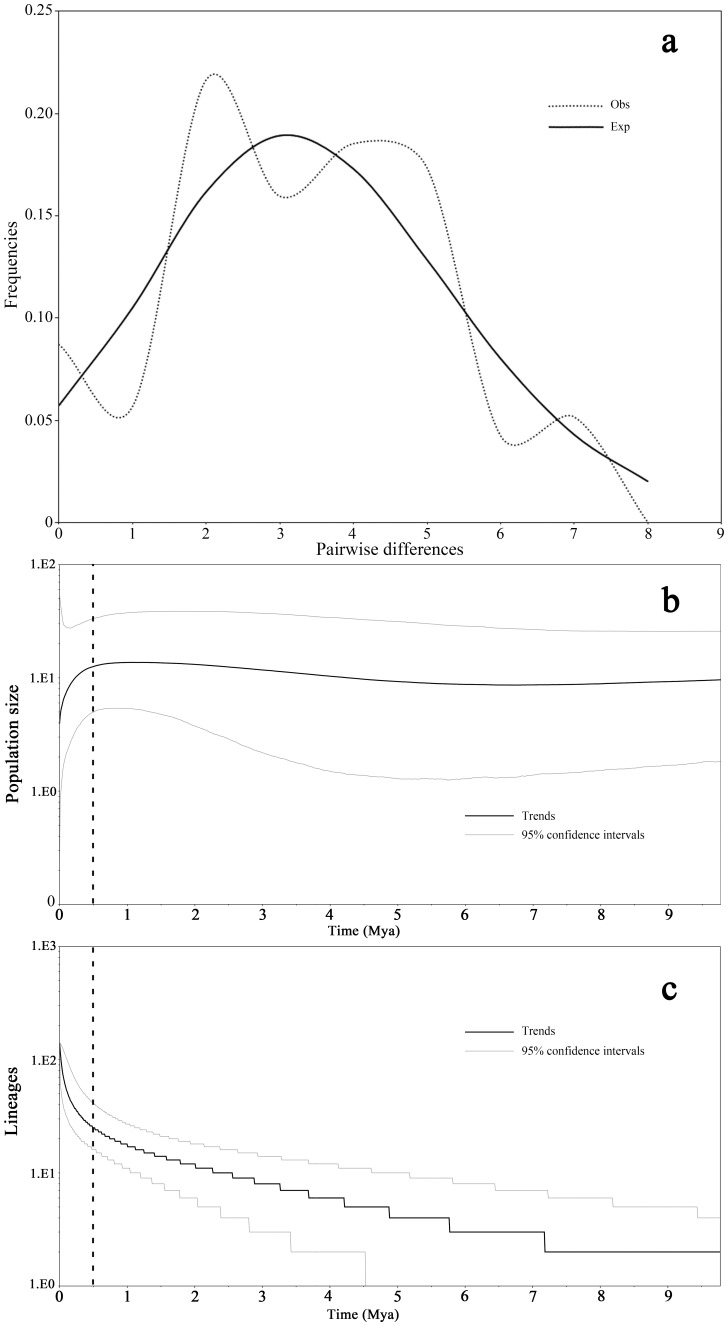
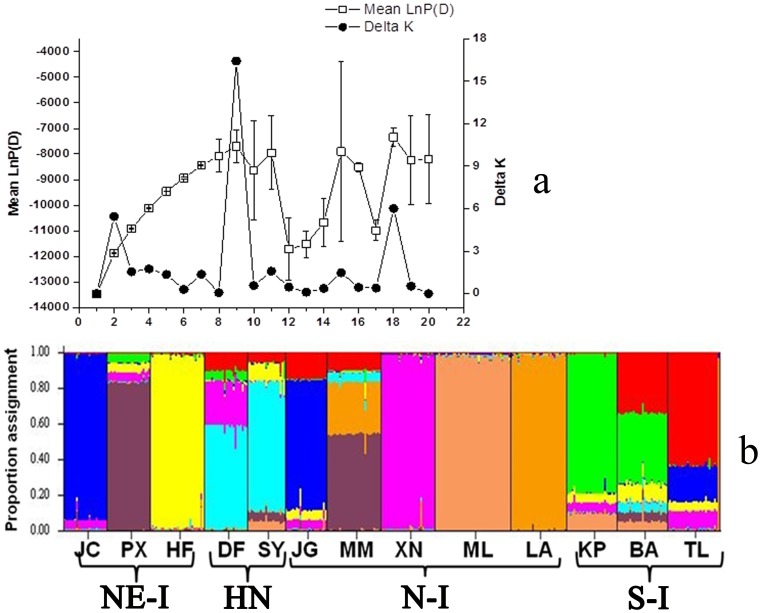
Methods: WE ANALYZED NUCLEOTIDE SEQUENCE DATA OF TWO CHLOROPLAST DNA (CPDNA: atpB-rbcL and trnD-trnT) regions and genotype data of six nuclear microsatellites from 15 populations (140 and 363 individuals, respectively) distributed in Indochina Peninsular and Hainan Island to infer the patterns of genetic diversity and phylogeographic structure. The population bottleneck and genetic drift were estimated based upon nuclear microsatellites data using the software programs BOTTLENECK and 2MOD. The lineage divergence times and past population dynamics based on cpDNA data were estimated using coalescent-based isolation-with-migration (IMa) and BEAST software programs.
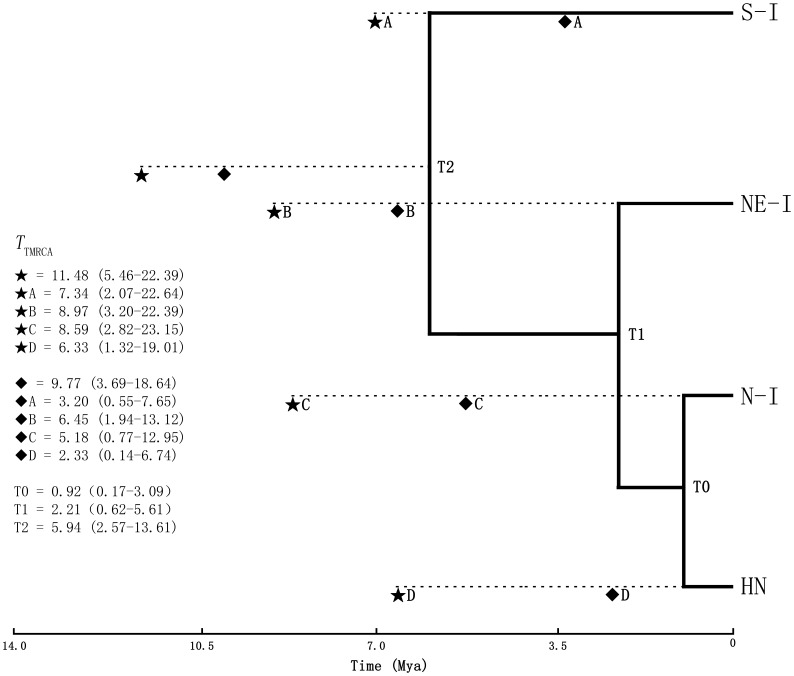
Results: A significant phylogeographic structure (N ST = 0.876, G ST = 0.796, F ST-SSR = 0.329, R ST = 0.449; N ST>G ST, R ST>F ST-SSR, P<0.05) and genetic differentiation among populations were detected. Bottleneck analyses and Bayesian skyline plot suggested recent population reduction. The cpDNA haplotype network revealed the ancestral populations from the southern Indochina region expanded to northward. The most recent ancestor divergence time of D. cambodiana dated back to the Tertiary era and rapid diversification of terminal lineages corresponded to the Quaternary period.
Conclusions: The results indicated that the present distribution of genetic diversity in D. cambodiana was an outcome of Tertiary dispersal and rapid divergence during the Quaternary period under limited gene flow influenced by the uplift of Himalayan-Tibetan Plateau and Quaternary climatic fluctuations respectively. Evolutionary processes, such as extinction-recolonization during the Pleistocene may have contributed to the fast diversification in D. cambodiana.
Conflict of interest statement
Figures
Similar articles
-
Low genetic diversity and local adaptive divergence of Dracaena cambodiana (Liliaceae) populations associated with historical population bottlenecks and natural selection: an endangered long-lived tree endemic to Hainan Island, China.Plant Biol (Stuttg). 2012 Sep;14(5):828-38. doi: 10.1111/j.1438-8677.2011.00559.x. Epub 2012 Mar 8. Plant Biol (Stuttg). 2012. PMID: 22404781
-
Phylogeographic patterns of the desert poplar in Northwest China shaped by both geology and climatic oscillations.BMC Evol Biol. 2018 May 25;18(1):75. doi: 10.1186/s12862-018-1194-1. BMC Evol Biol. 2018. PMID: 29801429 Free PMC article.
-
Strong phylogeographic pattern of cpDNA variation reveals multiple glacial refugia for Saruma henryi Oliv. (Aristolochiaceae), an endangered herb endemic to China.Mol Phylogenet Evol. 2010 Oct;57(1):176-88. doi: 10.1016/j.ympev.2010.07.001. Epub 2010 Jul 14. Mol Phylogenet Evol. 2010. PMID: 20637294
-
Geoclimatic drivers of diversification in the largest arid and semi-arid environment of the Neotropics: Perspectives from phylogeography.Mol Ecol. 2024 Jul;33(14):e17431. doi: 10.1111/mec.17431. Epub 2024 Jun 15. Mol Ecol. 2024. PMID: 38877815 Review.
-
Mountains as Evolutionary Arenas: Patterns, Emerging Approaches, Paradigm Shifts, and Their Implications for Plant Phylogeographic Research in the Tibeto-Himalayan Region.Front Plant Sci. 2019 Mar 18;10:195. doi: 10.3389/fpls.2019.00195. eCollection 2019. Front Plant Sci. 2019. PMID: 30936883 Free PMC article. Review.
Cited by
-
Population genetic structure of the endemic rosewoods Dalbergia cochinchinensis and D. oliveri at a regional scale reflects the Indochinese landscape and life-history traits.Ecol Evol. 2017 Dec 1;8(1):530-545. doi: 10.1002/ece3.3626. eCollection 2018 Jan. Ecol Evol. 2017. PMID: 29321891 Free PMC article.
-
Dracohodin Perochlorate Stimulates Fibroblast Proliferation via EGFR Activation and Downstream ERK/CREB and PI3K/Akt/mTOR Pathways In Vitro.Evid Based Complement Alternat Med. 2019 Aug 25;2019:6027186. doi: 10.1155/2019/6027186. eCollection 2019. Evid Based Complement Alternat Med. 2019. PMID: 31534465 Free PMC article.
References
-
- Hooghiemstra H, van der Hammen T (1998) Neogene and Quaternary development of the neotropical rain forest: the forest refugia hypothesis, and a literature overview. Earth-Sci Rev 44: 147–183.
-
- Colinvaux PA, De Oliveira PE, Bush MB (2000) Amazonian and neotropical plant communities on glacial time-scales: the failure of the aridity and refuge hypotheses. Quaternary Sci Rev 19: 141–169.
-
- Fjeldså J, Lovett JC (2004) Geographical patterns of old and young species in African forest biota: the significance of specific mountain areas as evolutionary centres. Biodivers Conserv 6: 325–346.
-
- Wiens JJ, Donoghue MJ (2004) Historical biogeography, ecology and species richness. Trends Ecol Evol 19: 639–644. - PubMed
-
- Mittelbach GG, Schemske DW, Cornell HV, Allen AP, Brown JM, et al. (2007) Evolution and the latitudinal diversity gradient: speciation, extinction and biogeography. Ecology Letters 10: 315–331. - PubMed
Publication types
MeSH terms
Substances
LinkOut - more resources
Full Text Sources
Other Literature Sources
Research Materials
Miscellaneous
