. 2013;8(4):e60228.
doi: 10.1371/journal.pone.0060228. Epub 2013 Apr 1.

Mycobacterium tuberculosis ClpP proteases are co-transcribed but exhibit different substrate specificities

Affiliations

Mycobacterium tuberculosis ClpP proteases are co-transcribed but exhibit different substrate specificities

Yoann Personne et al. PLoS One. 2013.

Abstract

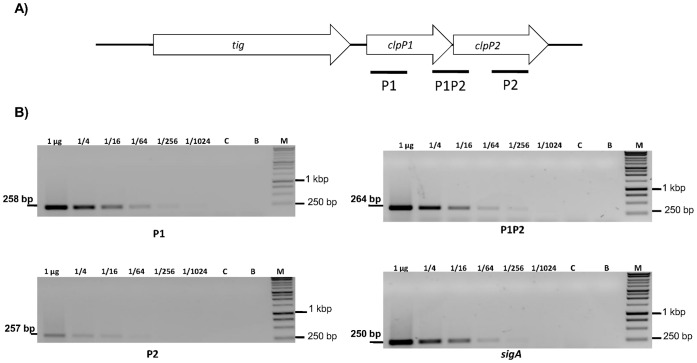
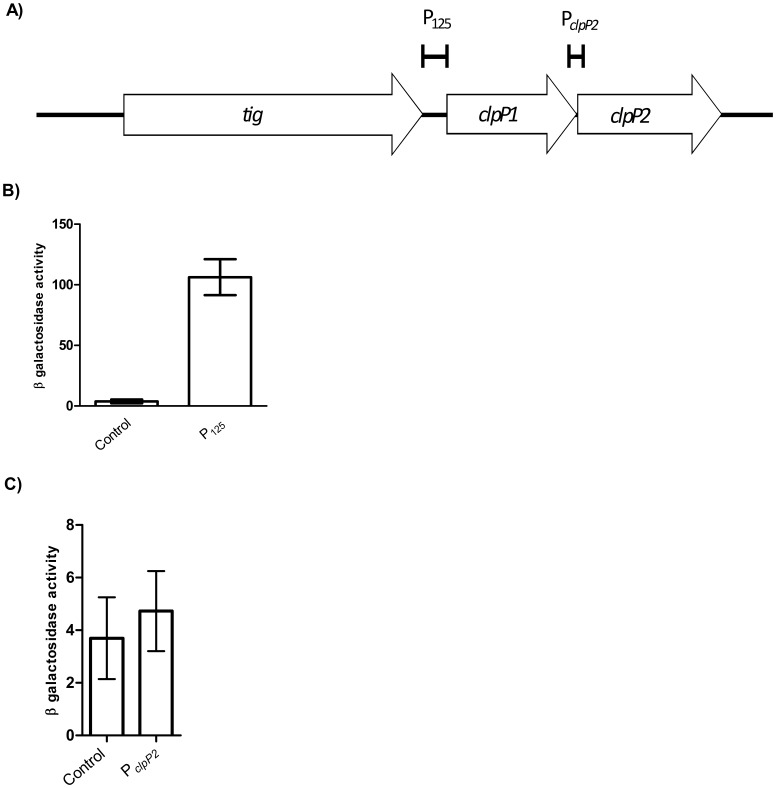
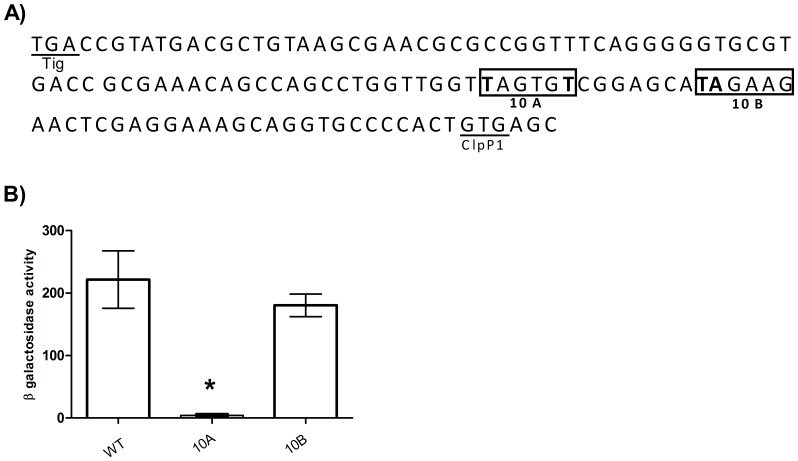
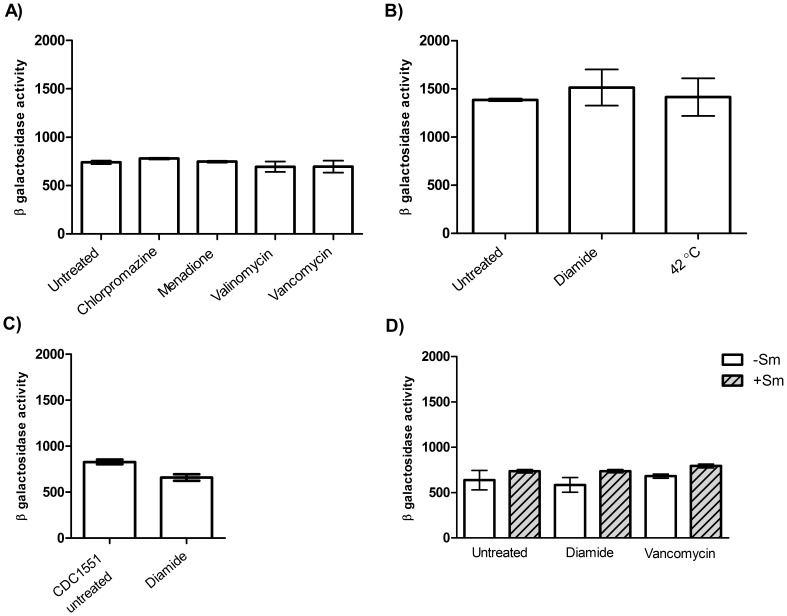
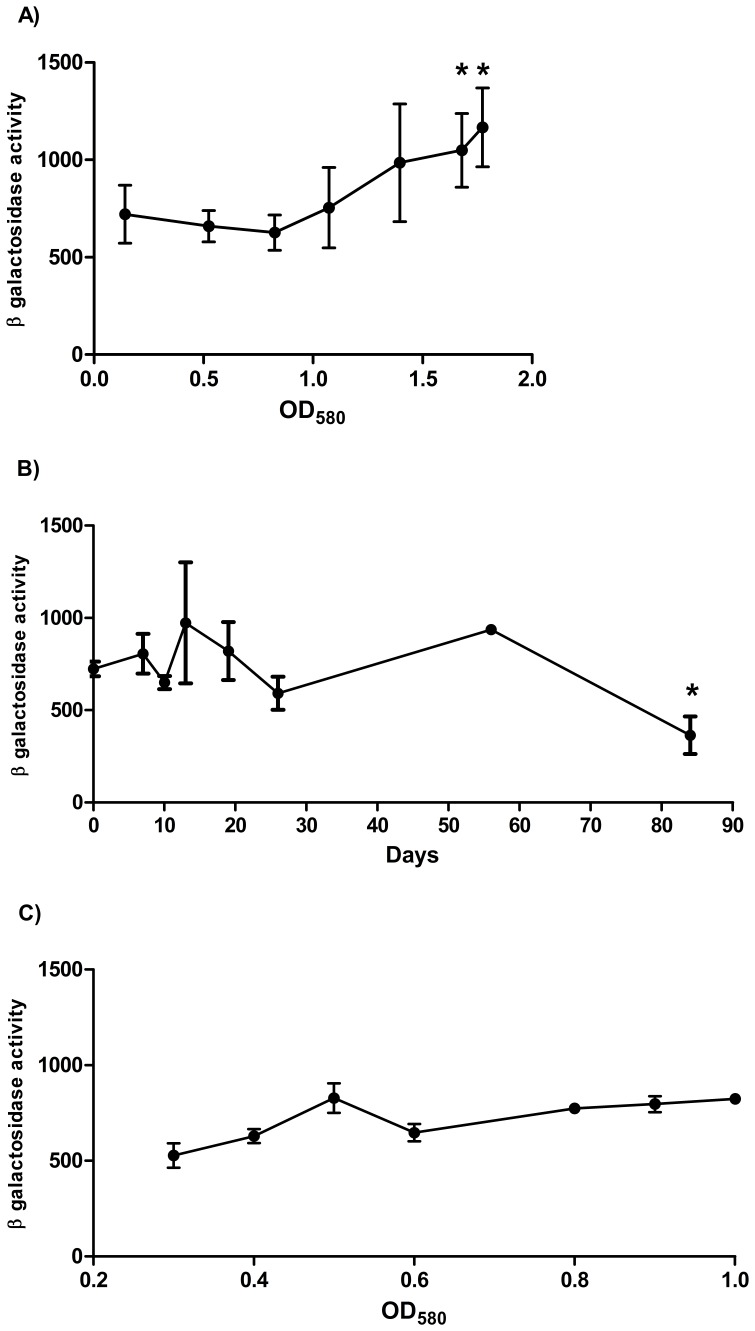
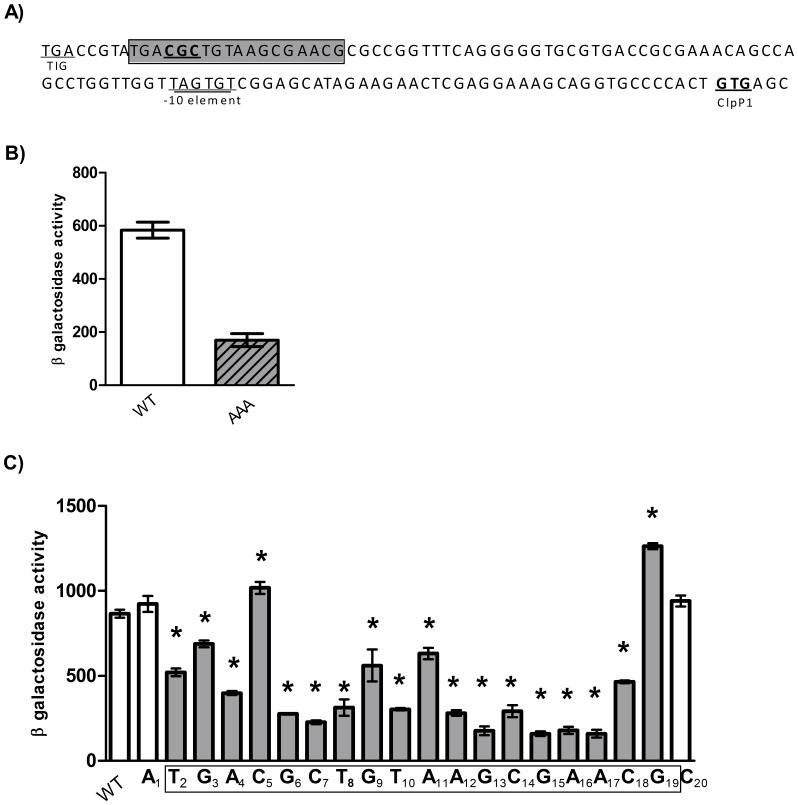
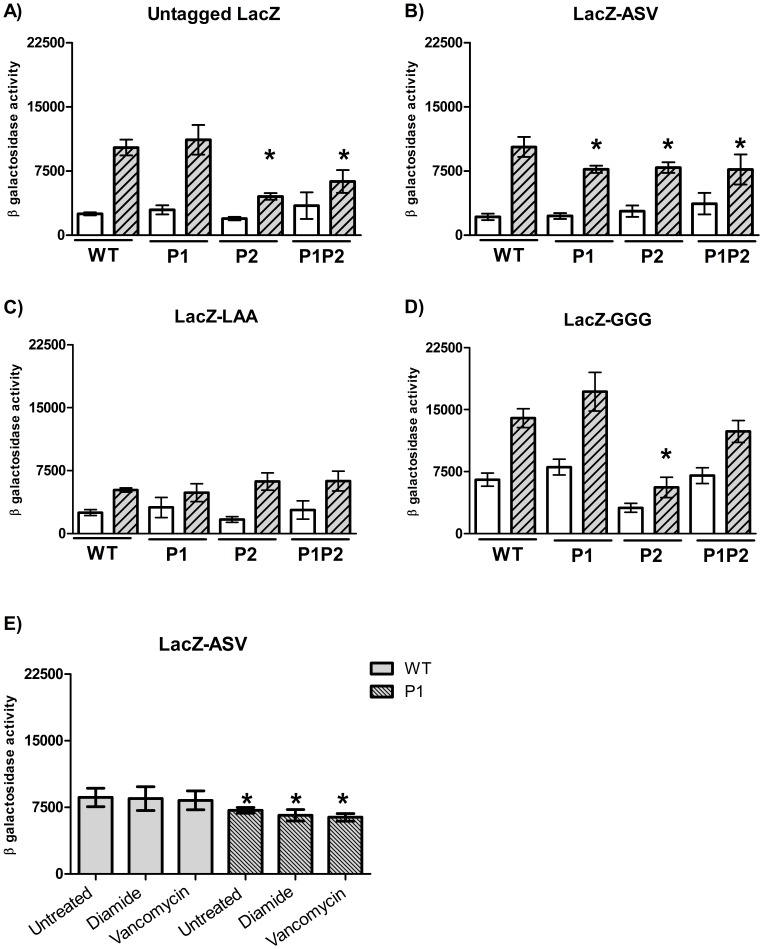
Caseinolytic (Clp) proteases are widespread energy-dependent proteases; the functional ATP-dependent protease is comprised of multimers of proteolytic and regulatory subunits. Mycobacterium tuberculosis has two ClpP proteolytic subunits (ClpP1 and ClpP2), with both being essential for growth in vitro. ClpP1 and clpP2 are arranged in an apparent operon; we demonstrated that the two genes are co-expressed under normal growth conditions. We identified a single promoter region for the clpP1P2 operon; no promoter was detected upstream of clpP2 demonstrating that independent expression of clpP1 and clpP2 was highly unlikely. Promoter activity was not induced by heat shock or oxidative stress. We identified a regulatory region upstream of the promoter with a consensus sequence matching the ClgR regulator motif; we determined the limits of the region by mutagenesis and confirmed that positive regulation of the promoter occurs in M. tuberculosis. We developed a reporter system to monitor ClpP1 and ClpP2 enzymatic activities based on LacZ incorporating ssrAtag sequences. We showed that whilst both ClpP1 and ClpP2 degrade SsrA-tagged LacZ, ClpP2 (but not ClpP1) degrades untagged proteins. Our data suggest that the two proteolytic subunits display different substrate specificities and therefore have different, but overlapping roles in M. tuberculosis.


Conflict of interest statement

Competing Interests: Tanya Parish served on the Editorial Board of PLOS ONE. This does not alter the authors’ adherence to all the PLOS ONE policies on sharing data and materials, as detailed online in the guide for authors.

Figures

Figure 1
Figure 1. clpP1 and clpP2 are co-transcribed as an operon.
A) Chromosomal organisation of clpP1 and clpP2. Regions amplified for RT-PCR are marked. B) Limiting dilution semi-quantitiative RT-PCR. RNA was extracted from M. tuberculosis grown to late exponential phase in liquid cultures and cDNA was synthesised from 1 µg of RNA. Serial 4- fold dilutions of cDNA were used as a template for PCR using primers specific for clpP1 (P1), clpP2 (P2), the clpP1-clpP2 junction (P1P2) and sigA. C: no RT control; B: no template blank, M: markers.
Figure 2
Figure 2. Identification of the promoter of the clpP1P2 operon.
A) The regions upstream of clpP1 or clpP2 tested for promoter activity are marked. B) P125 activity in M. tuberculosis. C) PclpP2 activity in M. tuberculosis. Promoter activity was measured in transformants grown to late exponential phase in standing liquid cultures. Results are the average activity ± standard deviation of three independent transformants assayed in duplicate. Activity is given in Miller Units (MU)- measured as nmol of O-nitrophenol produced per min per mg of protein. Control = pSM128 empty vector control.
Figure 3
Figure 3. Identification of the −10 promoter element.
A) Sequence of the P125 region upstream of clpP1P2. Putative −10 elements (10A and 10B) are boxed. The residues mutated are in bold. The predicted ClpP1 start codon and Tig stop codons are indicated. B) Identification of the −10 element. The following mutations were made - 10A: TAGTGT mutated to CAGTGG; 10B: TAGAAG mutated to CGGAAG. Results are the average activity of three independent transformants assayed in duplicate ± standard deviation. Activity is given in Miller Units (MU)- measured as nmol of O-nitrophenol produced per min per mg of protein. The background activity from pSM128 (control vector) was 4±2 MU. A significant difference, measured by the student’s t-test (unpaired, two sided), compared to the control vector (pSM128) is marked by an *(p<0.05).
Figure 4
Figure 4. P278 promoter activity was not induced by stress treatments.
A) P278 promoter activity in standing liquid cultures. Treatments were: 50 µg/mL of chlorpromazine for 3 h, 10 µg/mL of menadione for 3 h, 10 µg/mL of valinomycin for 3h, 6 µg/mL of vancomycin for 90 min. B) Promoter activity in rolling cultures. Treatments were: 42°C for 1 h, 10 mM diamide for 1 h C) Promoter activity in response to diamide treatment in M. tuberculosis CDC1551. D) Promoter activity in response to diamide and vancomycin treatments in presence or absence of streptomycin selection. Stress treatments were 10 mM diamide for 1 h or 6 µg/mL of vancomycin for 90 min. The average and standard deviation of three independent transformants assayed in duplicate is given. ß-galactosidase activity is given in Miller Units - measured as nmol of O-nitrophenol produced over time (min) per mg of protein. Activity is given in Miller Units (MU)- measured as nmol of O-nitrophenol produced per min per mg of protein. The background activity from pSM128 (control vector) was 6±3 MU under the different conditions tested.
Figure 5
Figure 5. Promoter activity during aerobic growth, hypoxia, and reaeration in M. tuberculosis.
A) M. tuberculosis transformants harbouring P278 were grown in aerobic culture. Results are the average activity of three transformants against average OD580. A significant difference, measured by the student’s t-test (unpaired, two sided), compared to promoter activity at OD580 = 0.15 is marked by an *(p<0.05). B) P278 promoter activity in the Wayne model of hypoxia. M. tuberculosis liquid cultures were inoculated to a theoretical starting OD580 of 0.004 in DTA medium. A significant difference compared to activity at day 0 is marked by an *(p<0.05) using the student’s t-test (unpaired, two sided). C) P278 promoter activity after reaeration. Long term hypoxic cultures (12 weeks) were used to inoculate medium and grown in aerobic rolling cultures. Cell-free extracts were prepared once the cultures reached an OD580 of 0.3. Results are the average activity of three independent transformants assayed in duplicate ± standard deviation. Activity is given in Miller Units- measured as nmol of O-nitrophenol produced per min per mg of protein.
Figure 6
Figure 6. Identification of key residues in a regulatory region of the clpP1P2 operon.
A) Sequence of the region upstream of clpP1P2. The tig stop codon, −10 promoter element, and clpP1 start codons are underlined. The 18 nucleotides that constitute the regulatory region are boxed in grey. The CGC region mutated is underlined in bold. B) Identification of a regulatory region. The CGC motif (underlined bold) was mutated to AAA. C) Mapping of a regulatory binding site. Single nucleotide substitutions in P278 were made by SDM. Residues A or T were mutated to G or and residues C or G were mutated to A. Results are the average activity of three independent transformants assayed in duplicate ± standard deviation. Activity is given in Miller Units- measured as nmol of O-nitrophenol produced per min per mg of protein. A significant difference of activity compared to wild-type P278 is marked by an *(p<0.05) using the student’s t-test (unpaired, two sided).
Figure 7
Figure 7. Protein turnover in strains over-expressing ClpP subunits.
A to D) M. tuberculosis transformants were grown to late exponential phase in standing liquid cultures in presence of succinate +/− acetamide (0.1% w/v) and cell-free extracts were prepared and β-galactosidase activity measured. Empty bars: uninduced conditions (succinate); Grey striped bars: induced conditions (succinate+acetamide). A significant difference measured by the student’s t-test (unpaired, two sided) compared to the induced LacZ level in the WT strain is marked by an *(p<0.05). E) Three M. tuberculosis transformants carrying LacZ-ASV were grown to late exponential phase in standing liquid cultures in presence of acetamide (0.1% w/v) and cell-free extracts were prepared. Treatments were 10 mM diamide for 1 h or 6 µg/mL of vancomycin for 90 min. A significant difference from untreated WT is marked by an *(p<0.05). Results are the average activity of three independent transformants assayed in duplicate ± standard deviation. Activity is given in Miller Units- measured as nmol of O-nitrophenol produced per min per mg of protein. Strains are- WT: wild-type; P1: over-expressing ClpP1; P2: over-expressing ClpP2; P1P2: over-expressing ClpP1 and ClpP2.

Similar articles

Cited by

References

    1. WHO (2011) Global tuberculosis control. Available at: http://www.who.int/tb/publications/global_report/en/index.html (Accessed 1st August 2012).
    1. Rawlings ND, Barrett AJ, Bateman A (2010) MEROPS: the peptidase database. Nucleic Acids Res 38: D227–233. - PMC - PubMed
    1. Porankiewicz J, Wang J, Clarke AK (1999) New insights into the ATP-dependent Clp protease: Escherichia coli and beyond. Mol Microbiol 32: 449–458. - PubMed
    1. Carroll P, Faray-Kele MC, Parish T (2011) Identifying vulnerable pathways in Mycobacterium tuberculosis by using a knockdown approach. Appl Environ Microbiol 77: 5040–5043. - PMC - PubMed
    1. Ollinger J, O’Malley T, Kesicki EA, Odingo J, Parish T (2011) Validation of the essential ClpP protease in Mycobacterium tuberculosis as a novel drug target. J Bacteriol 194: 663–668. - PMC - PubMed

Publication types

MeSH terms

LinkOut - more resources