. 2013 Apr 2;104(7):1465-75.
doi: 10.1016/j.bpj.2013.02.042.

Lateral membrane diffusion modulated by a minimal actin cortex

Affiliations

Lateral membrane diffusion modulated by a minimal actin cortex

Fabian Heinemann et al. Biophys J. .

Erratum in

  • Biophys J. 2013 May 7;104(9):2110

Abstract

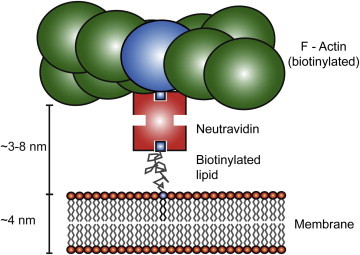
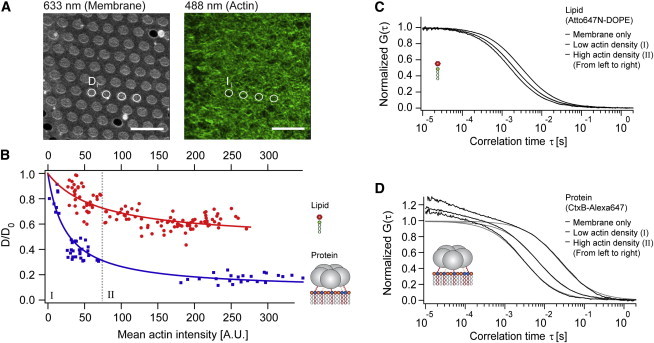
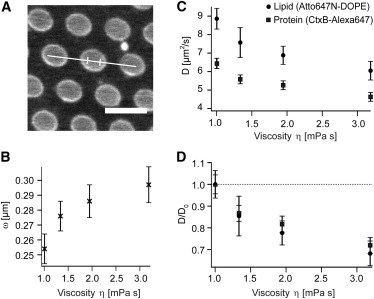
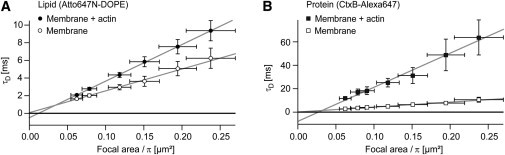
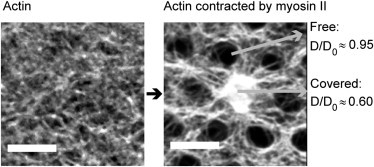
Diffusion of lipids and proteins within the cell membrane is essential for numerous membrane-dependent processes including signaling and molecular interactions. It is assumed that the membrane-associated cytoskeleton modulates lateral diffusion. Here, we use a minimal actin cortex to directly study proposed effects of an actin meshwork on the diffusion in a well-defined system. The lateral diffusion of a lipid and a protein probe at varying densities of membrane-bound actin was characterized by fluorescence correlation spectroscopy (FCS). A clear correlation of actin density and reduction in mobility was observed for both the lipid and the protein probe. At high actin densities, the effect on the protein probe was ∼3.5-fold stronger compared to the lipid. Moreover, addition of myosin filaments, which contract the actin mesh, allowed switching between fast and slow diffusion in the minimal system. Spot variation FCS was in accordance with a model of fast microscopic diffusion and slower macroscopic diffusion. Complementing Monte Carlo simulations support the analysis of the experimental FCS data. Our results suggest a stronger interaction of the actin mesh with the larger protein probe compared to the lipid. This might point toward a mechanism where cortical actin controls membrane diffusion in a strong size-dependent manner.


Figures

Figure 1
Figure 1
Scheme of the MAC. The filamentous biotinylated (blue) actin is coupled via neutravidin to the free-standing membrane (Egg PC) containing biotinylated lipids (DSPE-PEG(2000)-Biotin). For a more compact display the binding of actin is shown only to the upper leaflet of the membrane. In the experiments, actin presumably binds to both leaflets, because both membrane sides are accessible and contain biotinylated lipids.
Figure 2
Figure 2
Correlation of the mean actin fluorescence (actin density) and the decrease in lateral membrane diffusion. (A) Confocal fluorescence images of free-standing membranes containing Atto647N-DOPE (left) and Alexa-488-phalloidin-labeled actin filaments (right) exhibiting a dense filamentous meshwork associated with the membrane. Diffusion coefficients Di were determined by FCS in the center of numbered free-standing membrane spots i. The corresponding actin density Ii was determined from the average fluorescence intensity in a circular area of the respective spot i. Scale bars: 10 μm. (B) Relative change in diffusion coefficients plotted versus the mean actin intensity (measure of actin density) for the labeled lipid (red circles) and the membrane binding protein (blue squares). Each point represents a pair of measurements of Di and Ii, the solid line is an empirical fit with an asymptotic function. Changes in diffusion are shown after normalization to D0, the diffusion coefficient of the respective probe in the membrane after neutravidin addition but before actin coupling. The gray dotted line separates regime I (left) and regime II (right). (C and D) Potential effects on the shape of the FCS autocorrelation curves were investigated by classifying the data according to the actin density (I – low density, II – high density). FCS curves were class-averaged (black) and fitted with a model for 2D diffusion assuming single-component membrane diffusion (Eq. S2 or S3 in the Supporting Material, gray). At the timescales relevant for 2D diffusion, the theoretical models were a reasonable fit to the experimental data for the lipid (C) and the protein (D) independent of the actin density.
Figure 3
Figure 3
Effect of solution viscosity on the diffusion of the protein and the lipid (in the absence of actin). The viscosity of the solution was varied using different concentrations of sucrose. (A) Diffusion coefficients were determined by LSFCS, because compared to point FCS this method is less susceptible to distortions of the focal volume due to the use of a solution with a refractive index deviating from that of water. A line was continuously scanned and the spatio-temporal correlation in a free-standing part (indicated by the two strokes) was computed and fitted with a model function for 2D diffusion. Scale bar 5 μm. (B) Increase in focal waist depending on the viscosity of the buffer as determined by LSFCS. (C) Absolute changes in the lateral diffusion D of the labeled lipid (circle) and the protein (square). The mobility of both probes decreases with increasing viscosity. (D) Plotting the relative changes in mobility shows that, in contrast to the experiments in the presence of actin, the diffusion of both probes is affected to a comparable extent. The diffusion coefficients were normalized to the respective diffusion coefficient at 0% sucrose. All error bars are standard deviations.
Figure 4
Figure 4
Spot variation FCS supports the view that upon presence of the actin mesh a transition from fast diffusion at a subdiffraction scale to slow macroscopic diffusion occurs. (A) Before actin linking, the diffusion time of the labeled lipid changes linearly with the spot size (open circles) and the extrapolation of the fitted line to zero spot size intersects at the origin (τd0 = 6 ± 209 μs). This is in agreement with a constant diffusion coefficient also at subdiffraction scales. In the presence of actin (solid circles), the extrapolation to the origin intersects at a slightly negative diffusion time (τd0 = −501 ± 241 μs). This could indicate a transition from fast diffusion (similar to the diffusion without actin) at a subdiffraction scale to slower diffusion on a larger scale (due to the presence of actin). (B) Furthermore, for the protein (open squares) the diffusion time in the membrane without actin scales linearly with the spot size and the fit intersects at the origin (τd0 = 62 ± 329 μs). In the presence of the actin mesh (solid squares) the extrapolated diffusion time at zero spot size is strongly negative (τd0 = −7880 ± 2400 μs), consistent with a transition from faster to slow diffusion at a subdiffraction scale, due to the presence of the actin mesh. All errors are standard deviations.
Figure 5
Figure 5
Scheme of the Monte Carlo simulations. (A) The actin membrane skeleton (gray) was modeled as a Voronoi mesh in an area of 10 μm edge length. Particles (not shown) performed a random walk and could cross the boundaries only with a certain probability pjump and were reflected otherwise. Simulated fluorescence traces were acquired in the mesh with Gaussian-shaped detection spots with a waist of 250 nm (circles). Subsequently, the corresponding autocorrelation functions were computed. Each simulation was characterized by the average mesh size, the mesh distribution (either a narrow, homogeneous mesh size distribution, or a broad, heterogeneous mesh size distribution) and the confinement strength pjump. (B) Example trajectories illustrating the influence of the parameter pjump. At a low jump probability (bottom), the trajectory of the diffusing particle was strongly affected by the mesh, resulting in a strong confinement. For a higher jump probability (top), the confinement in the mesh is weaker and the trajectory expands over a larger spatial scale. Both trajectories represent a random walk over 5 s.
Figure 6
Figure 6
Simulated autocorrelation curves at varying mesh diameters a and constant FCS detection spot area of ω = 250 nm. (A and B) Two examples with difference in confinement are shown. In both plots the autocorrelation curves from left to right were simulated with decreasing mesh diameter and by using the same set of Voronoi meshes. The leftmost curves were obtained with a mesh larger than the FCS detection area, for the middle curves mesh and detection area were similar, and the right curves were simulated with a mesh smaller than the detection area (from left to right: ω/a = 0, 0.5, 0.9, 1.1, 2.1, 3.1). In both cases a transition from fast single-component microscopic diffusion (diffusion inside the mesh) over an intermediate regime to slower macroscopic diffusion (diffusion on scales larger than the mesh) occurs. (A) Autocorrelation curves simulated at comparably weak confinement (pjump = 0.1). With decreasing mesh diameter the decay of the autocorrelation curve is shifted toward longer correlation times. (B) Autocorrelation curves simulated at stronger confinement (pjump = 0.01). In this case, a clear deviation from single-component diffusion at mesh diameters comparable to the detection spot size is evident, due to the shape of the autocorrelation curves.
Figure 7
Figure 7
Analysis of the autocorrelation data from the Monte Carlo simulations obtained by variation of the mesh diameter and confinement strength. (A) Error of a single-component diffusion model fit to the autocorrelation data from the simulations plotted versus the focal spot size ω divided by the mesh diameter a. The error was defined as the standard deviation between the simulation result and a single component fit. Different shades of gray represent different strong confinement. From ω/a → 0 (large mesh) over ω/a ≈ 1 (mesh similar to detection spot) to ω/a ≫ 1 (small mesh) the transition from single-component diffusion over nonsingle-component diffusion to single-component diffusion is evident. For strong confinement the deviations to single-component diffusion are strong, when spot size and mesh diameter have similar dimensions. For weak confinement these deviations at ω/a ≈ 1 are weak or negligible. (B) Change in apparent diffusion coefficient Dapp plotted versus the mesh density (see text for details). Dapp decreases with mesh density. Stronger confinement led to a faster decrease in diffusion. However, also for weak confinement (topmost two curves), which showed no deviation from single-component diffusion in (A), a clear reduction in diffusion was obtained. Dapp was calculated from a one-component fit to the simulation results. The data for (B) represent the same data set as used for (A).
Figure 8
Figure 8
Addition of myosin II allows switching the diffusive state of the membrane. The left image shows the fluorescence of actin (labeled with phalloidin-Alexa488) linked to membranes. Upon addition of myosin II, the actin filaments retract from most of the free-standing membrane patches, but also condense on some spots as shown in the right image. The diffusive behavior is modified accordingly. On the spots where actin was removed, the diffusion is comparable to the diffusion in a membrane before actin coupling, whereas the diffusion is reduced at spots where actin was concentrated. Both measurements are for the labeled lipid (Atto647N-DOPE). Scale bars 5 μm.

Similar articles

Cited by

References

    1. Singer S.J., Nicolson G.L. The fluid mosaic model of the structure of cell membranes. Science. 1972;175:720–731. - PubMed
    1. Vereb G., Szöllosi J., Damjanovich S. Dynamic, yet structured: The cell membrane three decades after the Singer-Nicolson model. Proc. Natl. Acad. Sci. USA. 2003;100:8053–8058. - PMC - PubMed
    1. Simons K., Gerl M.J. Revitalizing membrane rafts: new tools and insights. Nat. Rev. Mol. Cell Biol. 2010;11:688–699. - PubMed
    1. Engelman D.M. Membranes are more mosaic than fluid. Nature. 2005;438:578–580. - PubMed
    1. Sheetz M.P., Schindler M., Koppel D.E. Lateral mobility of integral membrane proteins is increased in spherocytic erythrocytes. Nature. 1980;285:510–511. - PubMed

Publication types

LinkOut - more resources