. 2013 Apr 25;3(4):1252-65.
doi: 10.1016/j.celrep.2013.03.004. Epub 2013 Apr 4.

Suppression of nucleotide metabolism underlies the establishment and maintenance of oncogene-induced senescence

Affiliations

Suppression of nucleotide metabolism underlies the establishment and maintenance of oncogene-induced senescence

Katherine M Aird et al. Cell Rep. .

Abstract

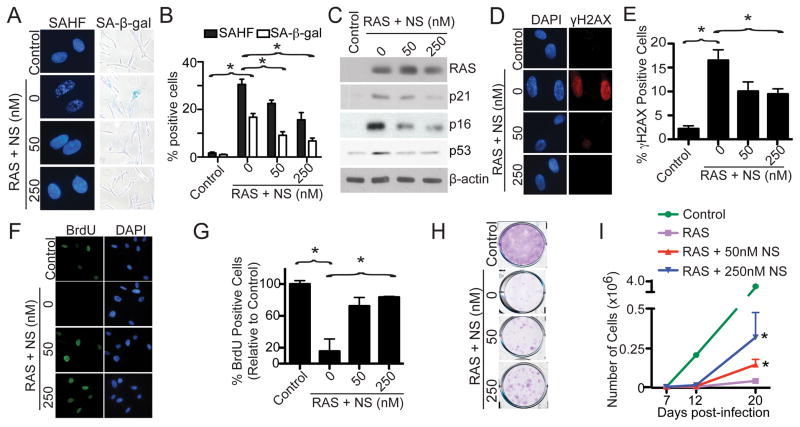
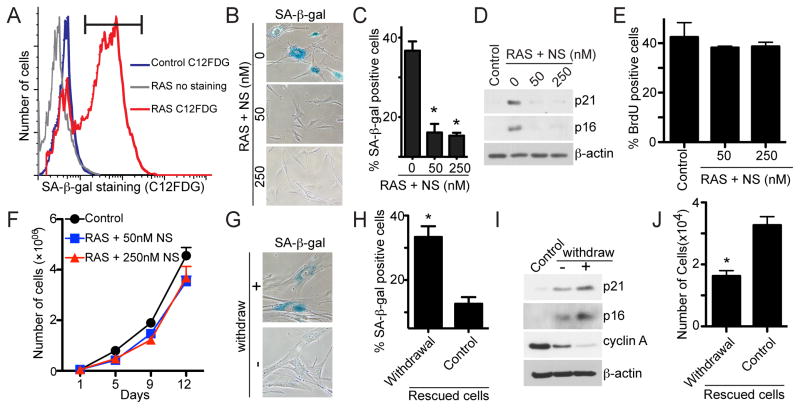
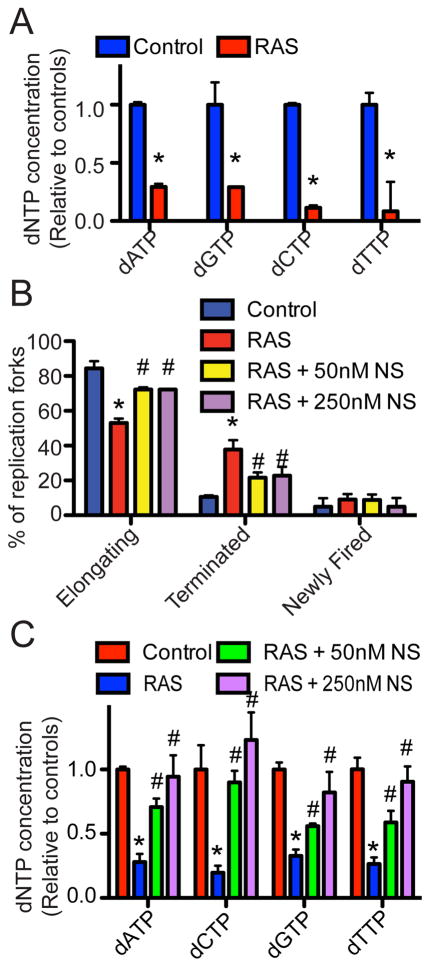
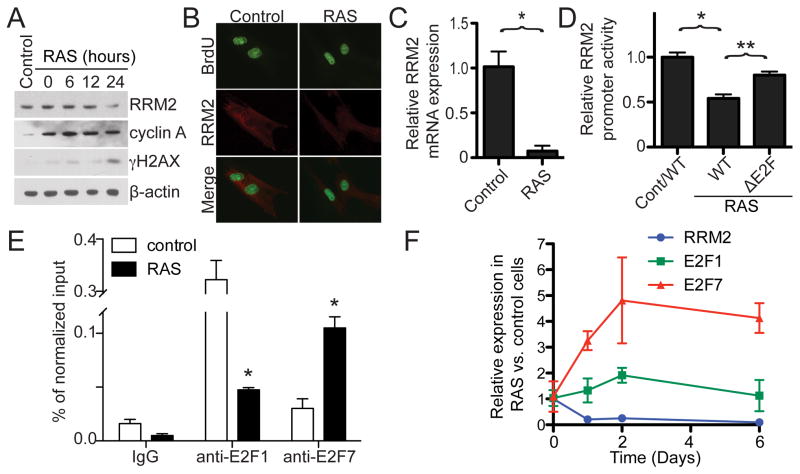
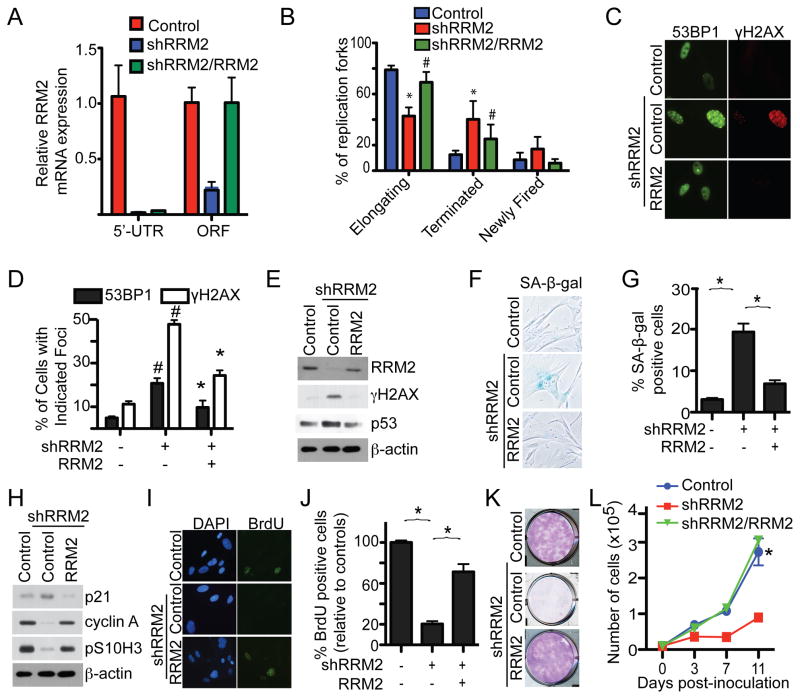
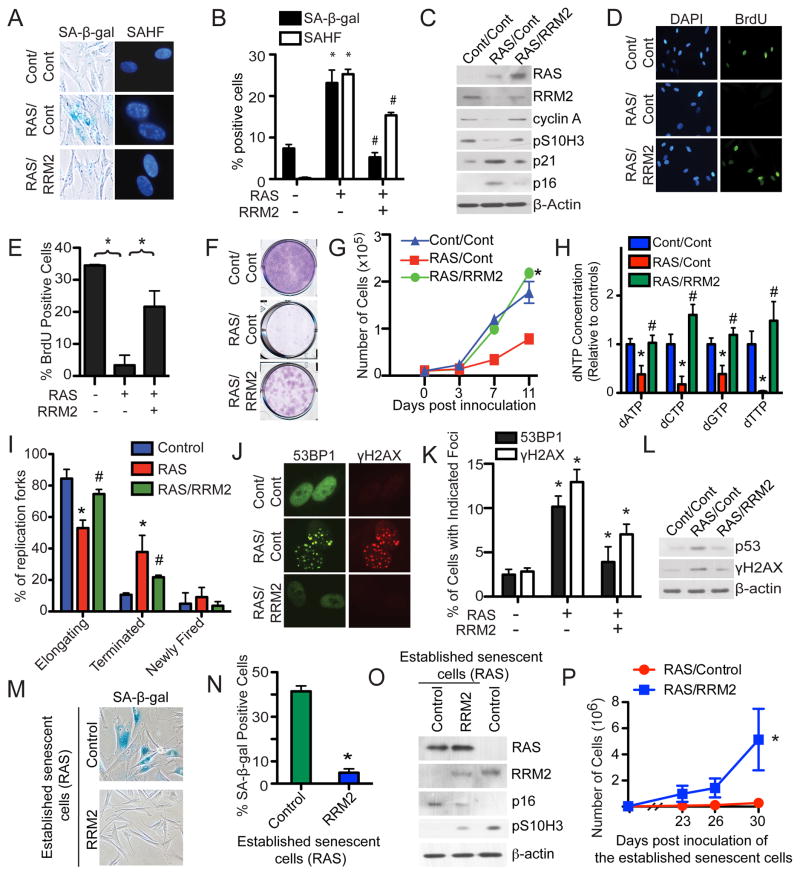
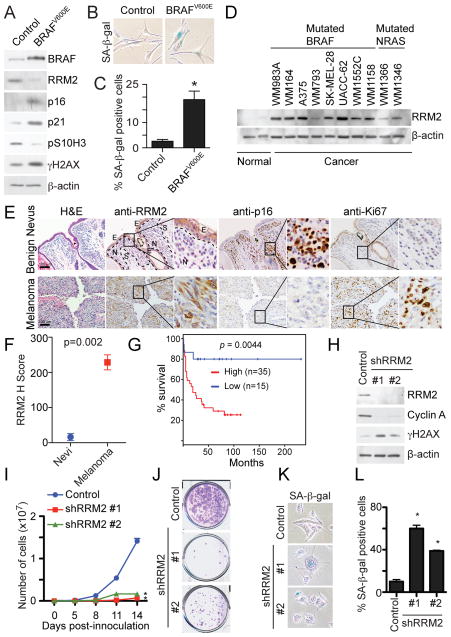
Oncogene-induced senescence is characterized by a stable cell growth arrest, thus providing a tumor suppression mechanism. However, the underlying mechanisms for this phenomenon remain unknown. Here, we show that a decrease in deoxyribonucleotide triphosphate (dNTP) levels underlies oncogene-induced stable senescence-associated cell growth arrest. The decrease in dNTP levels is caused by oncogene-induced repression of ribonucleotide reductase subunit M2 (RRM2), a rate-limiting protein in dNTP synthesis. This precedes the senescence-associated cell-cycle exit and coincides with the DNA damage response. Consistently, RRM2 downregulation is both necessary and sufficient for senescence. Strikingly, suppression of nucleotide metabolism by RRM2 repression is also necessary for maintenance of the stable senescence-associated cell growth arrest. Furthermore, RRM2 repression correlates with senescence status in benign nevi and melanoma, and its knockdown drives senescence of melanoma cells. These data reveal the molecular basis whereby the stable growth arrest of oncogene-induced senescence is established and maintained through suppression of nucleotide metabolism.


Figures

Figure 1
Figure 1. Exogenous nucleosides suppress OIS and its associated cell growth arrest. See also Figure S1
(A) IMR90 cells were infected with control or RAS encoding retrovirus with or without addition of the indicated concentration of nucleosides (NS) at the time of infection. On day 6, drug-selected cells were examined for SAHF formation and SA-β-gal activity. (B) Quantification of (A). Mean of three independent experiments with SEM. *p<0.05 (C) Same as (A) but examined for expression of RAS, p21, p16, p53 and β-actin by immunoblotting. (D) Same as (A) but stained for γH2AX foci formation. DAPI counterstaining was used to visualize nuclei. (E) Quantification of (D). Mean of three independent experiments with SEM. *p<0.05 (F) Same as (A) but labeled with BrdU for 1 hour. The incorporated BrdU was visualized by immunofluorescence. DAPI counterstaining was used to visualize nuclei. (G) Quantification of (F). Mean of three independent experiments with SEM. *p<0.01 (H) Same as (A) but an equal number of cells were inoculated in 6-well plates. After 2 weeks, the plates were stained with 0.05% crystal violet in PBS to visualize colony formation. Shown are representative images of three independent experiments. (I) Same as (A) but equal number of cells were seeded in 6-well plates. The number of cells was counted at the indicated time points after infection. Mean of three independent experiments with SEM. *p<0.05 compared with RAS alone cells.
Figure 2
Figure 2. Exogenous nucleosides are sufficient to overcome the stable OIS-associated cell growth arrest in established senescent cells. See also Figure S2
(A) IMR90 cells were infected with RAS-encoding retrovirus. On day 6, drug-selected cells were subjected to flow cytometric sorting (FACS) of SA-β-gal positive cells using C12FDG as a substrate. Black bar indicates the gate used for sorting. (B) FACS-sorted senescent cells were cultured without or with indicated concentrations of nucleosides (NS) for an additional 14 days. The cells were then stained for SA-β-gal activity. (C) Quantification of (B). Mean of three independent experiments with SEM. *p<0.001 (D) Same as (B) but examined for p16, p21 and β-actin expression by immunoblotting. (E) Same as (B) but labeled with BrdU for 1 hour. Mean of three independent experiments with SEM. (F) Same as (B) but an equal number of cells that overcome senescence or control (parental) cells were inoculated in 6-well plates, and the number of cells was counted at the indicated time points. Mean of three independent experiments with SEM. (G) Cells that overcome senescence in the presence of exogenous nucleosides (NS, 50 nM) isolated from (B) (rescued cells) were continually cultured in the presence of NS (control) or withdrawn from NS exposure for additional seventeen days and stained for SA-β-gal activity. (H) Quantification of (G). Mean of three independent experiments with SEM. *p<0.01 (I) Same as (G) but examined for p21, p16, cyclin A and β-actin expression by immunoblotting. (J) Same as (G) but an equal number of cells were inoculated in 6-well plates after withdrawal, and the number of cells was counted 4 days later. Mean of three independent experiments with SEM. *p<0.05
Figure 3
Figure 3. A decrease in dNTP levels occurs prior to the OIS-associated cell cycle exit. See also Figure S3
(A) IMR90 cells were infected with control or RAS encoding retrovirus. On day 2, cellular dNTP levels were measured. Mean of three independent experiments with SEM. *p<0.05. (B) Same as (A) but RAS-infected cells were supplemented with or without the indicated concentration of nucleosides (NS) at the time of infection. *p<0.05 control vs. RAS; and #p<0.05 RAS vs. RAS plus 50nM or 250nM NS. (C) Same as (B) but cellular dNTP levels were measured. *p<0.05 vs. control; #p<0.05 vs. RAS alone
Figure 4
Figure 4. Oncogene-induced repression of RRM2 occurs prior to the OIS-associated cell cycle exit. See also Figure S4
(A) IMR90 cells were infected with control or RAS encoding retrovirus. The expression of RRM2, cyclin A, γH2AX and β-actin was determined by immunoblotting at the indicated time points after completing RAS-infection. (B) IMR90 cells were infected with control or RAS-encoding retrovirus. On day 1, the infected cells were labeled with BrdU for 1 hour, and the expression of RRM2 in BrdU incorporated cells was visualized by immunofluorescence. (C) Same as (A) but cells were examined for RRM2 mRNA expression by qRT-PCR on day 1. Mean of three independent experiments with SEM. *p<0.01 (D) On day 2, drug-selected control or RAS-infected cells were electroporated with a luciferase reporter driven by a wild type (WT) or E2F binding site deleted (ΔE2F) mutant human proximal RRM2 gene promoter. A luminescent β-galactosidase reporter was used as an internal control to normalize the transfection efficacy. Mean of three independent experiments with SEM. *p<0.001 Control/WT vs. RAS/WT, **p<0.05 WT vs. ΔE2F (E) Same as (C) but cells were examined for E2F1 and E2F7 binding to the RRM2 promoter by chromatin immunoprecipitation using an anti-E2F1 or anti-E2F7 antibody. An isotype matched IgG was used a control. Mean of three independent experiments with SEM. *p<0.001 (F) IMR90 cells were infected with control or RAS-encoding retrovirus. Expression of RRM2, E2F1 and E2F7 mRNA was determined by qRT-PCR at the indicated time points. Mean of three independent experiments with SEM.
Figure 5
Figure 5. Knockdown of RRM2 decreases dNTP levels and induces senescence of primary human fibroblasts. See also Figure 5
(A) IMR90 cells were infected with a lentivirus-encoding shRRM2 that targets the 5′ UTR region of the human RRM2 gene together with a retrovirus encoding a control or wild type RRM2. On day 6, expression of RRM2 mRNA was determined by qRT-PCR using primers designed to its 5′ UTR region (only amplifies endogenous but not ectopic RRM2 mRNA) or its open reading frame (ORF) (amplifies both endogenous and ectopic RRM2 mRNA). (B) Same as (A) but examined for DNA replication dynamics using the DNA combing technique on day 2. Mean of three independent experiments with SEM. *p<0.05 control vs. shRRM2; and #p<0.05 shRRM2 alone vs. shRRM2/RRM2 (C) Same as (A) but examined for formation of 53BP1 and γH2AX foci by immunofluorescence at day 6. (D) Quantification of (C). Mean of three independent experiments with SEM. #p<0.001 vs. vector controls and *p<0.001 vs. shRRM2 only cells. (E) Same as (A) but examined for RRM2, γH2AX, p53 and β-actin expression by immunoblotting. (F) Same as (A) but stained for SA-β-gal activity. (G) Quantification of (F). Mean of three independent experiments with SEM. *p<0.001 (H) Same as (A) but examined for p21, cyclin A, pS10H3 and β-actin by immunoblotting. (I) Same as (A) but labeled with BrdU for 1 hour, and the incorporated BrdU was visualized by immunofluorescence. DAPI counterstaining was used to visualize nuclei. (J) Quantification of (I). The relative percentage of BrdU positive cells was calculated against vector controls. Mean of three independent experiments with SEM. *p<0.001 (K) Same as (A) but an equal number of the indicated cells were seeded in 6-well plates. After 2 weeks, the plates were stained with 0.05% crystal violet in PBS to visualize colony formation. Shown are representative images from three independent experiments. (L) Same as (K) but the number of cells was counted at the indicated time points. Mean of three independent experiments with SEM. *p<0.001 compared with cells expressing shRRM2 alone.
Figure 6
Figure 6. Ectopic RRM2 expression suppresses senescence and is sufficient to overcome the stable OIS-associated cell growth arrest
(A) IMR90 cells were co-infected with retrovirus encoding control or RAS together with or without RRM2. Cells were examined for SA-β-gal activity or SAHF expression on day 6. (B) Quantification of (A). Mean of three independent experiments with SEM. *p<0.05 control vs. RAS and #p<0.05 RAS alone vs. RAS/RRM2. (C) Same as (A) but examined for RAS, RRM2, cyclin A, pS10H3, p21, p16 and β-actin expression by immunoblotting. (D) Same as (A) but the cells were labeled with BrdU for 1 hour, and the BrdU incorporation was visualized by immunofluorescence. DAPI counterstaining was used to visualize nuclei. (E) Quantification of (D). Mean of three independent experiments with SEM. *p<0.01 (F) Same as (A) but equal number of the indicated cells were seeded in 6-well plates. After 2 weeks, the plates were stained with 0.05% crystal violet in PBS to visualize colony formation. Shown are representative images from three independent experiments. (G) Same as (F) but the number of cells were counted at the indicated time points. Mean of three independent experiments with SEM. *p<0.01 (H) Same as (A) but on day 2, the concentration of all four dNTPs was. *p<0.05 control vs. RAS and #p<0.05 RAS alone vs. RAS/RRM2 (I) Same as (H) but examined for DNA replication dynamics using the DNA combing technique on day 2. Mean of three independent experiments with SEM. *p<0.05 control vs. RAS and #p<0.05 RAS alone vs. RAS/RRM2 (J) Same as (A) but examined for the formation of 53BP1 and γH2AX foci by immunofluorescence at day 6. (K) Quantification of (J). Mean of three independent experiments with SEM. *p<0.05 (L) Same as (A) but examined for p53, γH2AX and β-actin expression by immunoblotting. (M) IMR90 cells were infected with RAS-encoding retrovirus. On day 6, established senescent cells were infected with a lentivirus encoding RRM2 or an empty vector control. After an additional 14 days, the cells were stained for SA-β-gal activity. (N) Quantification of (G). Mean of three independent experiments with SEM. *p<0.001 (O) Same as (M) but examined for RAS, RRM2, p16, pS10H3 and β-actin expression by immunoblotting. (P) Same as (M) but an equal number of cells were inoculated in 6-well plates, and the number of cells was counted at the indicated time points. Mean of three independent experiments with SEM. *p<0.05
Figure 7
Figure 7. RRM2 is repressed in human benign nevi while overexpressed in melanoma; knockdown of RRM2 drives senescence of melanoma cells. See also Figure S6 and Table S1
(A) Melanocytes were infected with a lentivirus encoding control or BRAFV600E. 21 days after infection, cells were examined for BRAF, RRM2, p16, p21, pS10H3 γH2AX and β-actin expression by immunoblotting. (B) Same as (A) but examined for SA-β-gal activity. (C) Quantification of (B). Mean of two independent experiments with SEM. *p<0.01 (D) RRM2 and β-actin expression in two individual isolations of normal human melanocytes and the indicated human melanoma cell lines by immunoblotting. Mutation status of BRAF and NRAS of the selected cell lines is indicated. (E) Immunohistochemical staining of RRM2, p16 and Ki67 in benign human nevus and human melanoma tissue specimens harboring oncogenic BRAF for NRAS. Shown are examples of a benign human nevus and a human melanoma tissue harboring oncogenic BRAFV600E. N, S and E indicate the nevus, stroma and epidermal compartments, respectively. (F) Quantification of RRM2 staining in (E). Expression of RRM2 in benign human nevi (n=5) and melanoma tissue specimens (n=7) was quantified using the histological score. (G) A high level of RRM2 expression correlates with shorter overall survival in human melanoma patients harboring oncogenic BRAF or NRAS. The univariate overall survival curve (Kaplan-Meier method) for melanoma patients (n=50) with high- or low- RRM2 expression as detailed in methods. (H) UACC-62 human melanoma cells were infected with control or two individual shRRM2 encoding lentivirus. RRM2, cyclin A, γH2AX and β-actin expression was determined by immunoblotting. (I) Same as (H) but an equal number of cells were seeded in 6-well plates, and the number of cells was counted at the indicated time points. Mean of three independent experiments with SEM. *p<0.05 compared with controls. (J) Same as (I) but after two additional weeks, the plates were stained with 0.05% crystal violet in PBS to visualize colony formation. Shown are representative images of three independent experiments. (K) Same as (H) but stained for SA-β-gal activity. (L) Quantification of (K). Mean of three independent experiments with SEM. *p<0.05 compared with controls.

Similar articles

Cited by

References

    1. Aksoy O, Chicas A, Zeng T, Zhao Z, McCurrach M, Wang X, Lowe SW. The atypical E2F family member E2F7 couples the p53 and RB pathways during cellular senescence. Genes Dev. 2012;26:1546–1557. - PMC - PubMed
    1. Bartkova J, Rezaei N, Liontos M, Karakaidos P, Kletsas D, Issaeva N, Vassiliou LV, Kolettas E, Niforou K, Zoumpourlis VC, et al. Oncogene-induced senescence is part of the tumorigenesis barrier imposed by DNA damage checkpoints. Nature. 2006;444:633–637. - PubMed
    1. Bester AC, Roniger M, Oren YS, Im MM, Sarni D, Chaoat M, Bensimon A, Zamir G, Shewach DS, Kerem B. Nucleotide deficiency promotes genomic instability in early stages of cancer development. Cell. 2011;145:435–446. - PMC - PubMed
    1. Campisi J. Senescent cells, tumor suppression, and organismal aging: good citizens, bad neighbors. Cell. 2005;120:513–522. - PubMed
    1. Campisi J, d’Adda di Fagagna F. Cellular senescence: when bad things happen to good cells. Nat Rev Mol Cell Biol. 2007;8:729–740. - PubMed

Publication types

MeSH terms