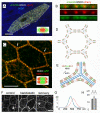
NMII forms a contractile transcellular sarcomeric network to regulate apical cell junctions and tissue geometry
- PMID: 23562268
- PMCID: PMC3658137
- DOI: 10.1016/j.cub.2013.03.039
NMII forms a contractile transcellular sarcomeric network to regulate apical cell junctions and tissue geometry
Abstract
Nonmuscle myosin II (NMII) is thought to be the master integrator of force within epithelial apical junctions, mediating epithelial tissue morphogenesis and tensional homeostasis. Mutations in NMII are associated with a number of diseases due to failures in cell-cell adhesion. However, the organization and the precise mechanism by which NMII generates and responds to tension along the intercellular junctional line are still not known. We discovered that periodic assemblies of bipolar NMII filaments interlace with perijunctional actin and α-actinin to form a continuous belt of muscle-like sarcomeric units (∼400-600 nm) around each epithelial cell. Remarkably, the sarcomeres of adjacent cells are precisely paired across the junctional line, forming an integrated, transcellular contractile network. The contraction/relaxation of paired sarcomeres concomitantly impacts changes in apical cell shape and tissue geometry. We show differential distribution of NMII isoforms across heterotypic junctions and evidence for compensation between isoforms. Our results provide a model for how NMII force generation is effected along the junctional perimeter of each cell and communicated across neighboring cells in the epithelial organization. The sarcomeric network also provides a well-defined target to investigate the multiple roles of NMII in junctional homeostasis as well as in development and disease.
Copyright © 2013 Elsevier Ltd. All rights reserved.
Figures


Comment in
-
Myosin transcellular networks regulate epithelial apical geometry.Cell Cycle. 2013 Sep 15;12(18):2931-2. doi: 10.4161/cc.26229. Epub 2013 Aug 23. Cell Cycle. 2013. PMID: 23974088 Free PMC article. No abstract available.
Similar articles
-
Myosin transcellular networks regulate epithelial apical geometry.Cell Cycle. 2013 Sep 15;12(18):2931-2. doi: 10.4161/cc.26229. Epub 2013 Aug 23. Cell Cycle. 2013. PMID: 23974088 Free PMC article. No abstract available.
-
Functions of nonmuscle myosin II in assembly of the cellular contractile system.PLoS One. 2012;7(7):e40814. doi: 10.1371/journal.pone.0040814. Epub 2012 Jul 13. PLoS One. 2012. PMID: 22808267 Free PMC article.
-
A unique role for nonmuscle myosin heavy chain IIA in regulation of epithelial apical junctions.PLoS One. 2007 Aug 1;2(7):e658. doi: 10.1371/journal.pone.0000658. PLoS One. 2007. PMID: 17668046 Free PMC article.
-
Assembly of myosin II filament arrays: Network Contraction versus Expansion.Cytoskeleton (Hoboken). 2018 Dec;75(12):545-549. doi: 10.1002/cm.21487. Epub 2018 Nov 14. Cytoskeleton (Hoboken). 2018. PMID: 30126071 Free PMC article. Review.
-
Nonmuscle Myosin II Regulation Directs Its Multiple Roles in Cell Migration and Division.Annu Rev Cell Dev Biol. 2021 Oct 6;37:285-310. doi: 10.1146/annurev-cellbio-042721-105528. Epub 2021 Jul 27. Annu Rev Cell Dev Biol. 2021. PMID: 34314591 Review.
Cited by
-
An RPTPα/Src family kinase/Rap1 signaling module recruits myosin IIB to support contractile tension at apical E-cadherin junctions.Mol Biol Cell. 2015 Apr 1;26(7):1249-62. doi: 10.1091/mbc.E14-07-1223. Epub 2015 Jan 28. Mol Biol Cell. 2015. PMID: 25631816 Free PMC article.
-
Actin cytoskeleton dynamics during mucosal inflammation: a view from broken epithelial barriers.Curr Opin Physiol. 2021 Feb;19:10-16. doi: 10.1016/j.cophys.2020.06.012. Epub 2020 Jun 30. Curr Opin Physiol. 2021. PMID: 32728653 Free PMC article.
-
ECM Substrates Impact RNAi Localization at Adherens Junctions of Colon Epithelial Cells.Cells. 2022 Nov 23;11(23):3740. doi: 10.3390/cells11233740. Cells. 2022. PMID: 36497003 Free PMC article.
-
Myosin transcellular networks regulate epithelial apical geometry.Cell Cycle. 2013 Sep 15;12(18):2931-2. doi: 10.4161/cc.26229. Epub 2013 Aug 23. Cell Cycle. 2013. PMID: 23974088 Free PMC article. No abstract available.
-
Cingulin and paracingulin tether myosins-2 to junctions to mechanoregulate the plasma membrane.J Cell Biol. 2023 Jul 3;222(7):e202208065. doi: 10.1083/jcb.202208065. Epub 2023 May 19. J Cell Biol. 2023. PMID: 37204781 Free PMC article.
References
-
- Bertet C, Sulak L, Lecuit T. Myosin-dependent junction remodelling controls planar cell intercalation and axis elongation. Nature. 2004;429:667–671. - PubMed
-
- Conti MA, Even-Ram S, Liu C, Yamada KM, Adelstein RS. Defects in Cell Adhesion and the Visceral Endoderm following Ablation of Nonmuscle Myosin Heavy Chain II-A in Mice. Journal of Biological Chemistry. 2004;279:41263–41266. - PubMed
Publication types
MeSH terms
Substances
Grants and funding
LinkOut - more resources
Full Text Sources
Other Literature Sources
Molecular Biology Databases
Research Materials

