. 2013 Apr 11;153(2):449-60.
doi: 10.1016/j.cell.2013.03.020. Epub 2013 Apr 4.

Non-cell-autonomous tumor suppression by p53

Affiliations

Non-cell-autonomous tumor suppression by p53

Amaia Lujambio et al. Cell. .

Abstract

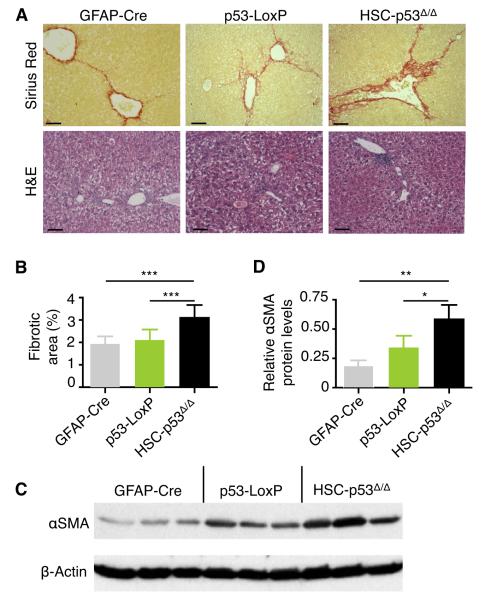
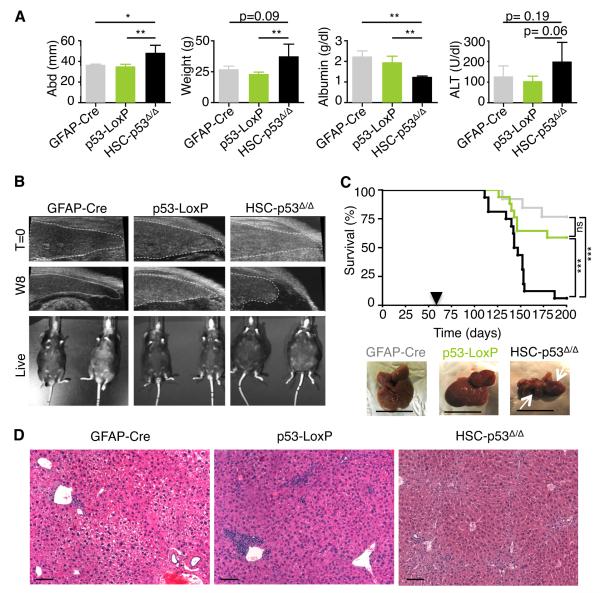
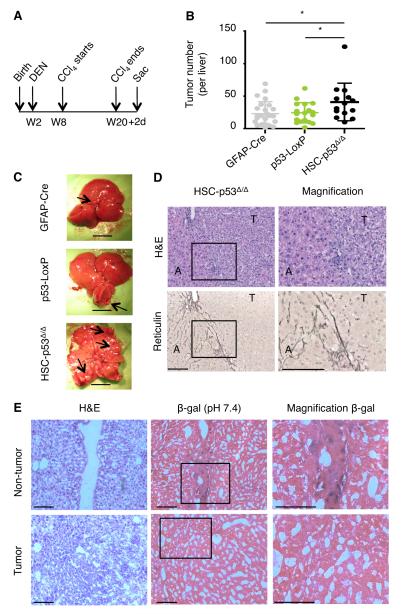
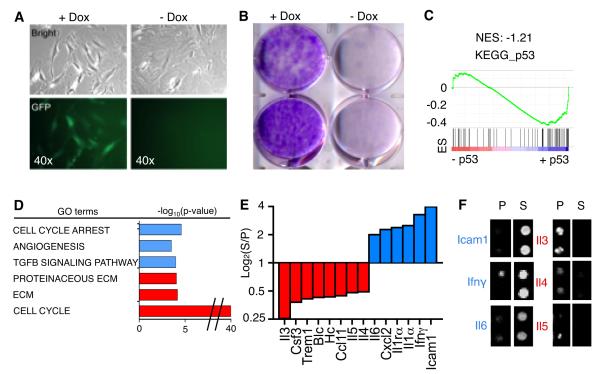
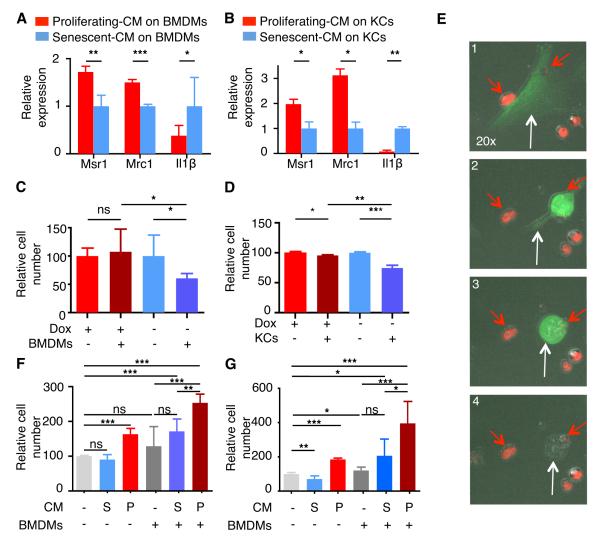
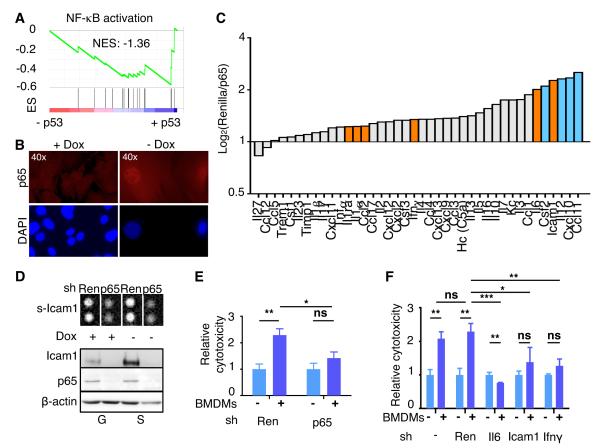
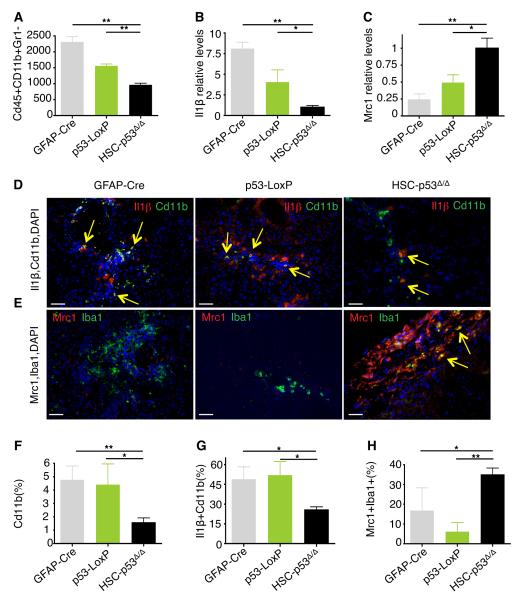
The p53 tumor suppressor can restrict malignant transformation by triggering cell-autonomous programs of cell-cycle arrest or apoptosis. p53 also promotes cellular senescence, a tumor-suppressive program that involves stable cell-cycle arrest and secretion of factors that modify the tissue microenvironment. In the presence of chronic liver damage, we show that ablation of a p53-dependent senescence program in hepatic stellate cells increases liver fibrosis and cirrhosis associated with reduced survival and enhances the transformation of adjacent epithelial cells into hepatocellular carcinoma. p53-expressing senescent stellate cells release factors that skew macrophage polarization toward a tumor-inhibiting M1-state capable of attacking senescent cells in culture, whereas proliferating p53-deficient stellate cells secrete factors that stimulate polarization of macrophages into a tumor-promoting M2-state and enhance the proliferation of premalignant cells. Hence, p53 can act non-cell autonomously to suppress tumorigenesis by promoting an antitumor microenvironment, in part, through secreted factors that modulate macrophage function.


Figures

Fig. 1
Fig. 1. p53 action in HSCs limits fibrosis
(A) Transgenic mice were treated with CCl4 for 6 weeks and fibrosis was assessed by Sirius Red (upper panel) and H&E (lower panel) staining. Scale bars are 100 μm. (B) Quantification of fibrosis based on Sirius Red staining by laser scanning cytometry. At least 3 liver sections were analyzed per mouse (number of mice: n = 12, GFAP-Cre; n = 14, p53-LoxP; n = 20, HSC-p53Δ/Δ). Values are mean + SD. (C and D) Immunoblot showing expression of αSMA in the livers of mice treated with CCl4 for six weeks (C). Quantification of αSMA relative to β-actin levels using ImageJ software (D). Values are mean + SD. H&E, Hematoxylin and Eosin. αSMA, α-smooth muscle actin. SD, standard deviation. See also Figure S1.
Fig. 2
Fig. 2. p53 activity in HSCs restrains cirrhosis
(A) Abdomen width and mouse weight (week 8), and ALT and albumin levels (week 13) in mice treated with CCl4. Values are mean + SD. n = 4, GFAP-Cre; n = 5, p53-LoxP; n = 3, HSC-p53Δ/Δ. (B) Ultrasound imaging of transgenic mice treated with CCl4 (week 8 of treatment). The live images show ascites only in a representative HSC-p53Δ/Δ male mouse. (C) Kaplan-Meier curve documenting survival of mice treated with CCl4. Arrowhead indicates beginning of CCl4 treatment. Statistical comparison of Kaplan–Meier curves is based on the log-rank test. Representative livers are displayed (white arrows represent liver retraction). Scale bars are 1 cm. GFAP-Cre in grey, n = 14; p53-LoxP in green, n = 20; HSC-p53Δ/Δ in black, n = 19. (D) HSC-p53Δ/Δ but not single-transgenic (GFAP-Cre and p53-LoxP) mice treated with CCl4 exhibited disrupted liver histology evaluated by H&E staining. Scale bars are 100 μm. W8, week 8. abd, abdomen width. n, number of mice. ALT, alanine transaminase. H&E, Hematoxylin and Eosin. See also Figure S2.
Fig. 3
Fig. 3. p53 activity in HSCs limits epithelial tumorigenesis
(A) Schematic diagram indicating the time points for DEN and CCl4 treatment. (B and C) Number of macroscopic tumors. Scatter plot representation; dots indicate individual animals and bars mean +/− SD. If the top and bottom values are deleted in all groups: p = 0.0119 (GFAP-Cre vs HSC-p53Δ/Δ) and p = 0.0039 (p53-LoxP vs HSC-p53Δ/Δ). If the outlier in HSC-p53Δ/Δ mice is removed: p = 0.0640 (GFAP-Cre vs HSC-p53Δ/Δ) and p = 0.0318 (p53-LoxP vs HSC-p53Δ/Δ). Representative livers from the three genotypes are displayed. Scale bars are 1 cm. Black arrows indicate tumors. (D) H&E (top) and Reticulin (bottom) staining of a representative liver from treated HSC-p53Δ/Δ mice. Right, magnification of the boxed area on the left. Scale bars are 100 μm. (E) Liver tissues (H&E staining, left) were stained for transgenic Lac-Z expression (β-gal staining). β-gal positive HSCs accumulated in the fibrotic scars (top panel). However, liver tumor cells were β-gal negative, indicating absence of recombination events. HSC-p53Δ/Δ;R26-LSL-Lacz triple-transgenic mice were used and 36 livers were analyzed. W, weeks. D, days. H&E, Hematoxylin and Eosin. T, tumor. A, adjacent liver. β-gal, β-galactosidase. See also Figure S3.
Fig. 4
Fig. 4. p53 regulates SASP of HSCs and genes affecting macrophage function
(A) Activated HSCs from CMV-rtTA;TG-p53.1224 mouse in the presence or absence of Dox (proliferating or senescent, respectively) by phase-contrast microscopy for changes in morphology (top panel) and expression of GFP (bottom panel). (B) Activation of p53 was sufficient to restrict colony formation as assessed by crystal violet staining 10 days after plating. (C) GSEA plot evaluating changes in p53 pathway (KEGG_p53) depending on p53 expression. (D) GO analysis of genes significantly downregulated (red) or upregulated (blue) upon p53 expression. Differentially expressed genes were identified by comparing senescent (blue) versus proliferating (red) HSCs. Representative examples are displayed. (E and F) Murine cytokine array for conditioned media from proliferating versus senescent HSCs. Bars represent the average of intensity of two independent experiments (log2). Factors showing 2-fold increase (blue) or decrease (red) on senescent versus proliferating HSCs are shown. In the right, representative blots from the cytokine array (F). ES, Enrichment score. NES, Normalized enrichment score. S, senescent. P, proliferating. See also Figure S4 and Table S1.
Fig. 5
Fig. 5. p53 signaling through SASP modulates macrophage polarization and function
(A and B) Quantitative RT-PCR of Msr1, Mrc1 and Il1β expression in BMDMs (A) or KCs (B) exposed to CM from proliferating (red) or senescent (blue) HSCs. Data are relative to expression of BMDMs with CM from senescent HSCs, normalized to the average expression of the housekeeping genes Hprt and Ubc. Values are mean + SD from three independent experiments. (C and D) BMDMs (C) and KCs (D) exhibited preferential cytotoxic activity against senescent HSCs (blue) when compared to proliferating HSCs (red). Viable cell numbers are shown and are relative to the number of viable cells without macrophages. Values are mean + SD from two independent experiments performed in triplicate . (E) Sequence of movie frames displaying the targeting of a senescent HSC (green cell; white arrow) by BMDMs (red cells; red arrows). (F and G) Cell viability in a co-culture experiment: premalignant cells were incubated with CM from proliferating (red) or senescent (blue) HSCs, and co-cultured with (+) or without (-) BMDMs. Two independent experiments were performed in triplicate for two different cell lines (F and G). Viable cell numbers are shown and are relative to the number of viable cells cultured without BMDMs and with normal media; values are mean + SD. BMDM, bone marrow-derived macrophages. KCs, Kupffer cells. CM, conditioned media. Ren, renilla. S, senescent. P, proliferating. See also Figure S5 and Movies S1.
Fig. 6
Fig. 6. NF-κB mediates p53-dependent SASP
(A) GSEA plots evaluating p53-dependent changes in NF-κB signaling pathway. (B) Immunostaining of proliferating (+Dox) and senescent HSCs (-Dox) with anti-p65 antibody (top panels) and counterstained with DAPI (bottom panels) to show nuclear NF-κB accumulation and SAHF formation, respectively, in senescent HSCs. (C) Murine cytokine array for conditioned media from senescent HSCs transduced with Renilla or p65 shRNA. Bars represent the average of two independent experiments (log2). Factors upregulated in senescent HSCs (Fig. 4E) are indicated in orange. (D) Top panel, cytokine array blot extract showing secreted Icam1 in cells transduced with Renilla or p65 shRNA, in proliferating or senescent HSCs. Bottom, p65 and Icam1 protein levels in the same cells. β-Actin serves as loading control. (E and F) Cytotoxicity of senescent HSCs (blue) infected with shRNAs (Renilla and p65 in E; Renilla, Il6, Ifnγ and Icam1 in F) and incubated with (+) or without (-) BMDMs. The cytotoxicity (dark blue) is relative to the basal cytotoxicity (light blue, in the absence of incubation with BMDMs, which has been normalized to 1). Values are mean + SD from triplicates. ES, Enrichment score. NES, Normalized enrichment score. Ren, renilla. BMDM, bone marrow-derived macrophages. See also S4, S6 and Table S1.
Fig. 7
Fig. 7. p53 activity in HSCs promotes an anti-tumor microenvironment
(A) Quantification of viable Cd45+Cd11b+Gr1− cells in CCl4-treated mice (n = 3 from each genotype). (B and C) Quantitative RT-PCR of FACS-sorted Cd45+Cd11b+Gr1− cells for Il1β (B) and Mrc1 (C) expression. The results are normalized to the average expression of the housekeeping genes Hprt and Ubc and relative to the expression in HSC-p53Δ/Δ mice. Values are mean + SD of 3 independent livers per genotype. (D-H) Staining for Cd11b (red) and Il1β (green) (D), and Iba1 (red) and Mrc1 (green) (E), revealing less Cd11b+ or Iba1+ macrophages, less Cd11b+Il1β+ macrophages and more Iba1+Mrc1+ macrophages in HSC-p53Δ/Δ CCl4-treated livers than in control livers. Quantification of Cd11b+ cells (% of total DAPI+ cells) (F), Cd11b+Il1β+ cells (% of total Cd11b+ cells) (G), and Mrc1+Iba1+ cells (% of total Iba+ cells) (H). Scale bars represent 100 μm. Yellow arrows indicate double-stained cells. See also Figure S7.

Comment in

References

    1. Acosta JC, O’Loghlen A, Banito A, Guijarro MV, Augert A, Raguz S, Fumagalli M, Da Costa M, Brown C, Popov N, et al. Chemokine signaling via the CXCR2 receptor reinforces senescence. Cell. 2008;133:1006–1018. - PubMed
    1. Bataller R, Brenner DA. Liver fibrosis. J Clin Invest. 2005;115:209–218. - PMC - PubMed
    1. Biswas SK, Mantovani A. Macrophage plasticity and interaction with lymphocyte subsets: cancer as a paradigm. Nat Immunol. 2010;11:889–896. - PubMed
    1. Campisi J, d’Adda di Fagagna F. Cellular senescence: when bad things happen to good cells. Nat Rev Mol Cell Biol. 2007;8:729–740. - PubMed
    1. Chien Y, Scuoppo C, Wang X, Fang X, Balgley B, Bolden JE, Premsrirut P, Luo W, Chicas A, Lee CS, et al. Control of the senescence-associated secretory phenotype by NF-kappaB promotes senescence and enhances chemosensitivity. Genes Dev. 2011;25:2125–2136. - PMC - PubMed

Publication types

MeSH terms

Associated data