. 2013 May 1;190(9):4773-85.
doi: 10.4049/jimmunol.1200057. Epub 2013 Apr 5.

Intestinal CCL11 and eosinophilic inflammation is regulated by myeloid cell-specific RelA/p65 in mice

Affiliations

Intestinal CCL11 and eosinophilic inflammation is regulated by myeloid cell-specific RelA/p65 in mice

Amanda Waddell et al. J Immunol. .

Abstract

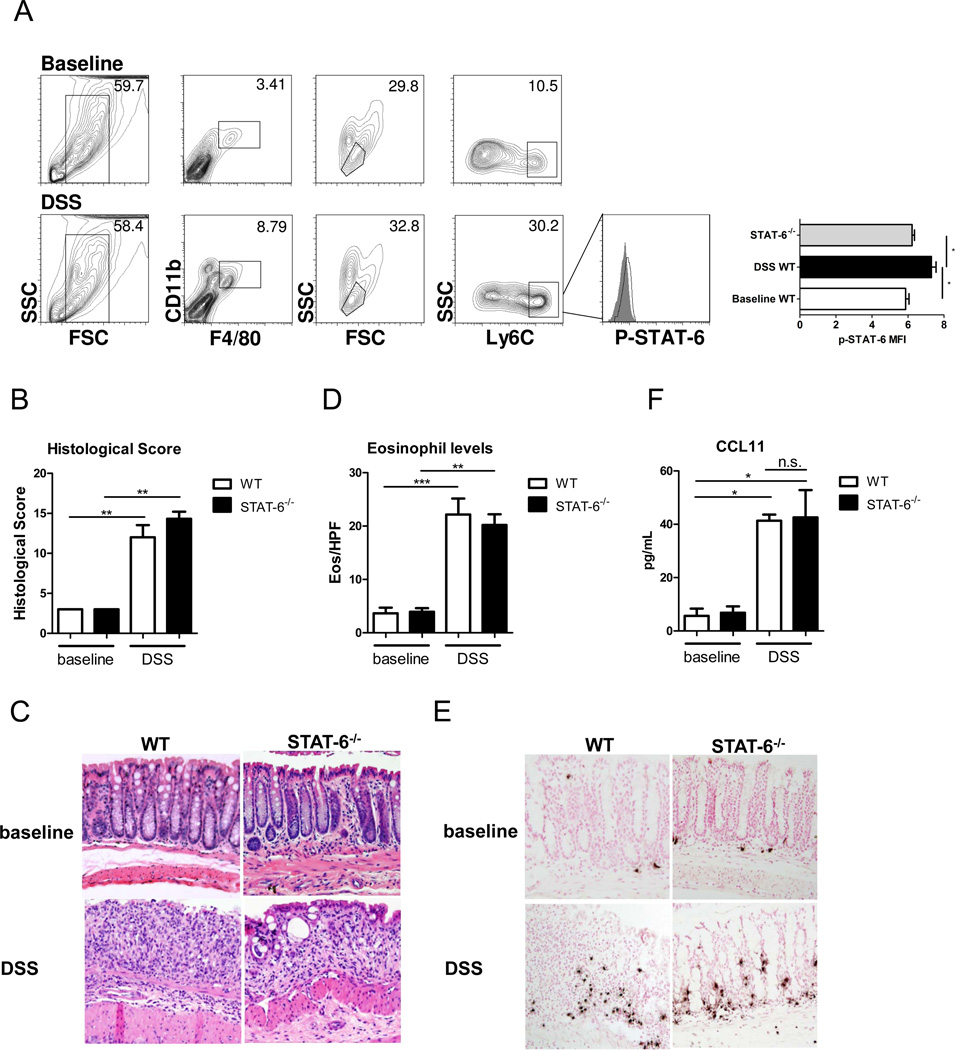
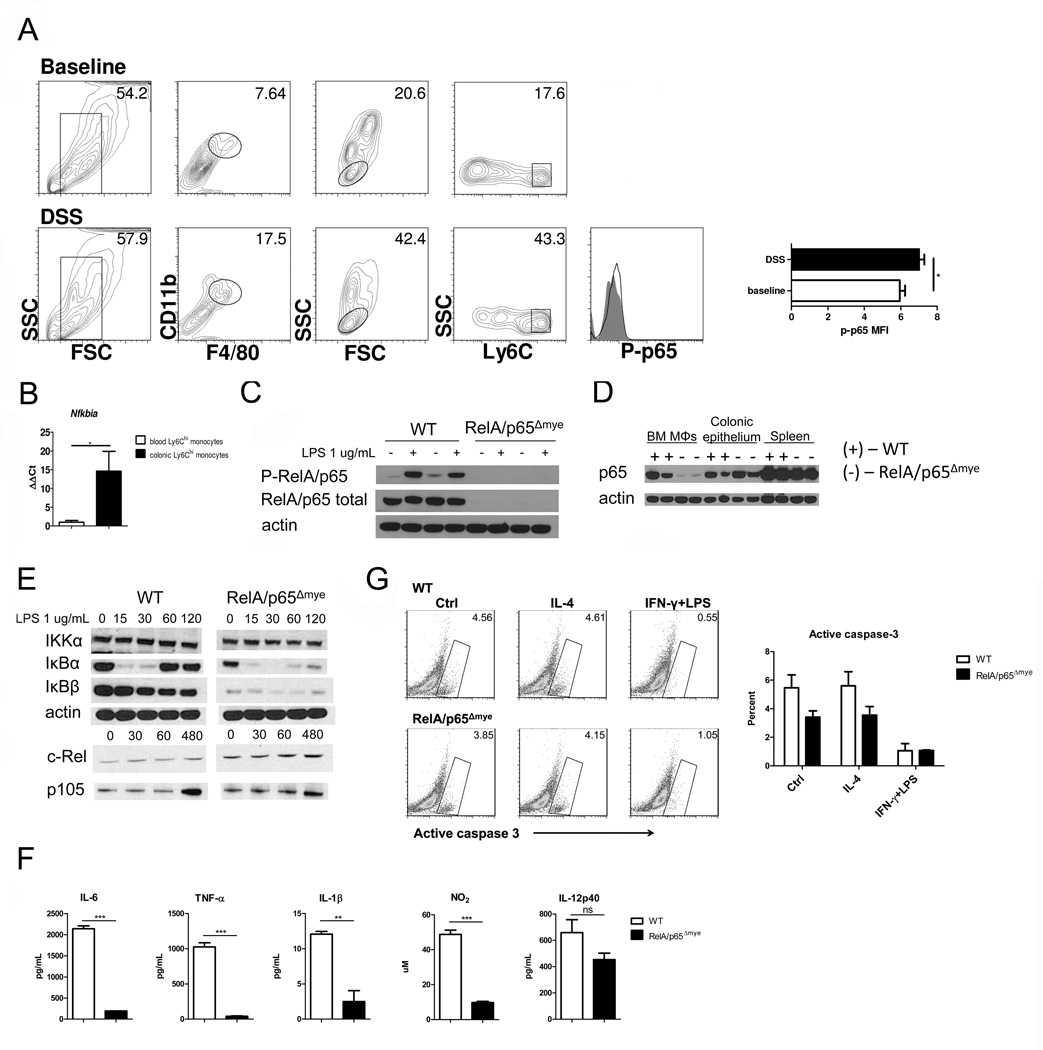
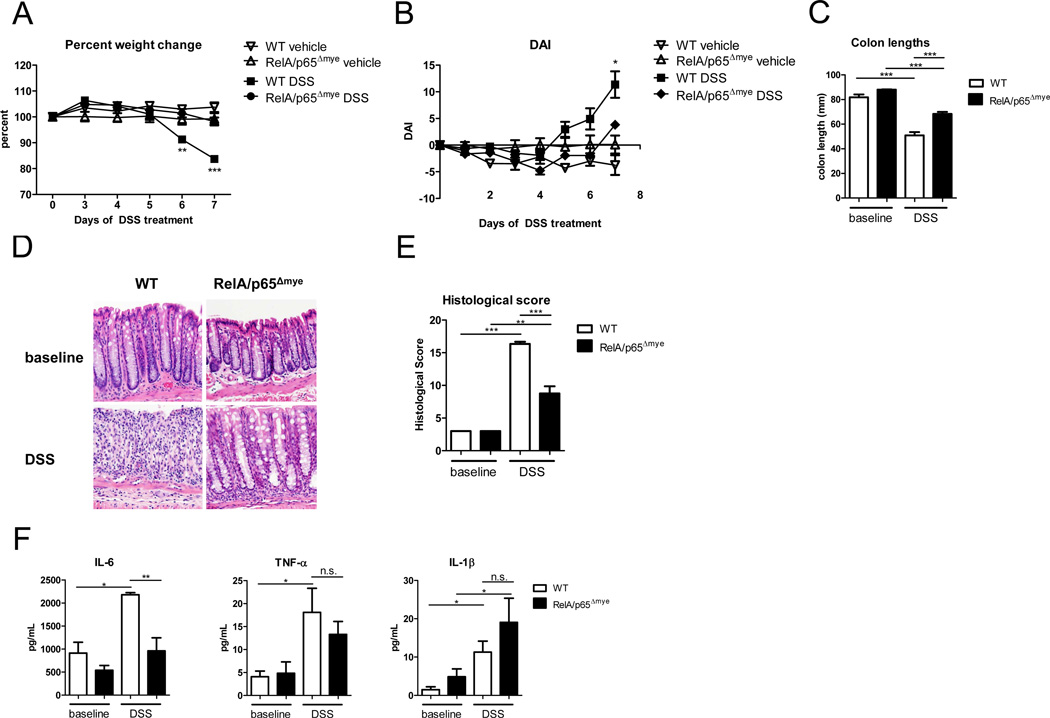
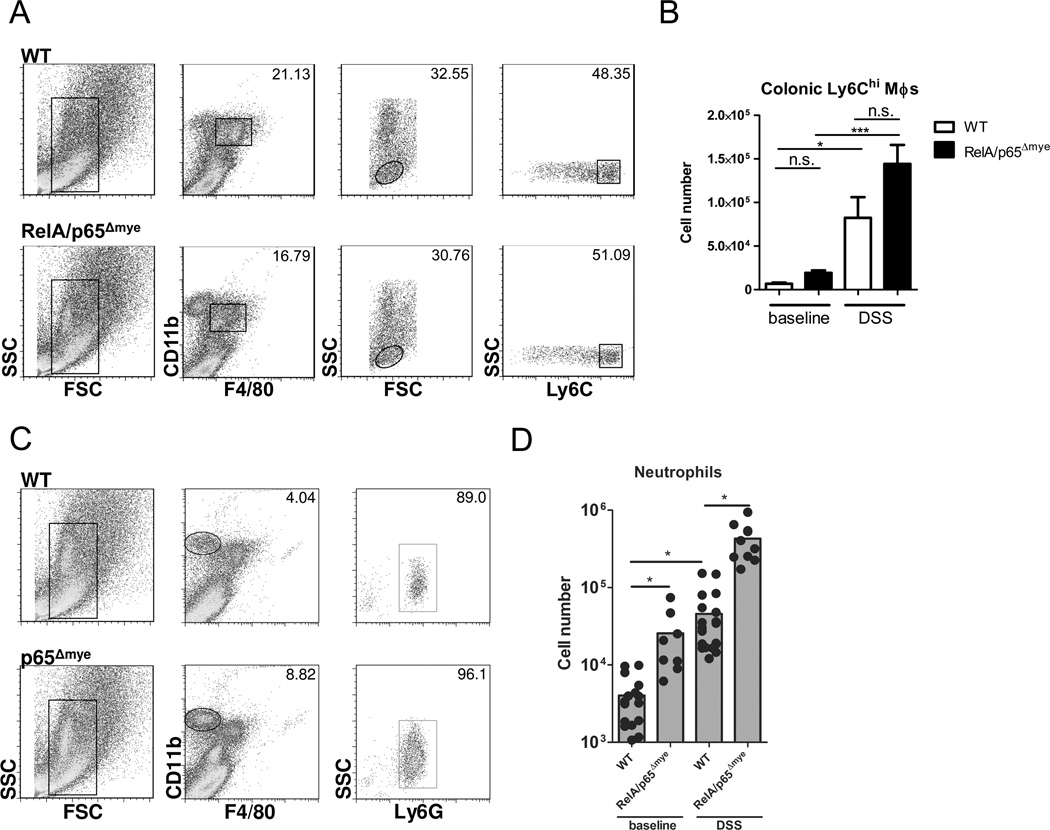
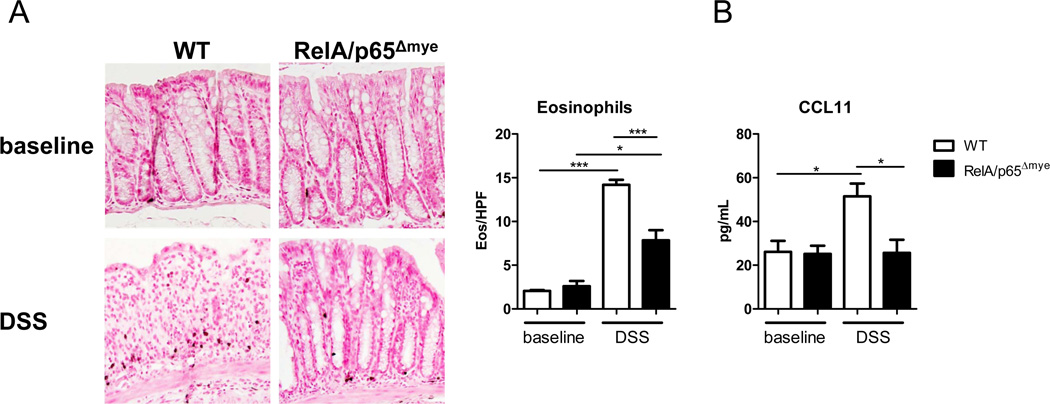
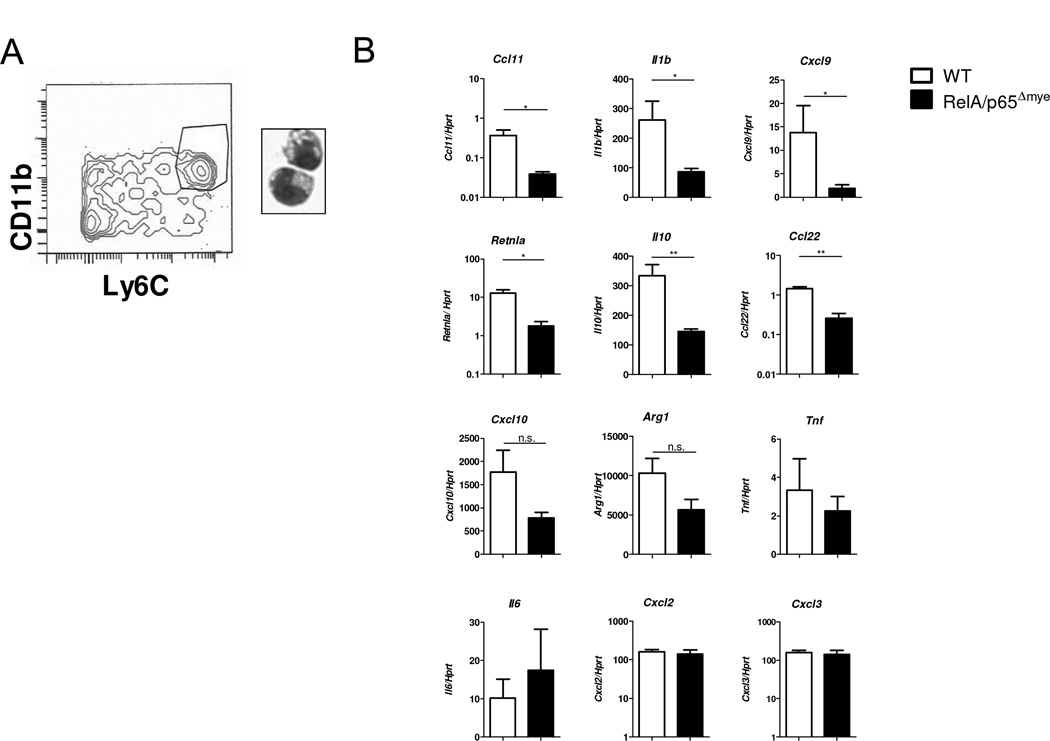
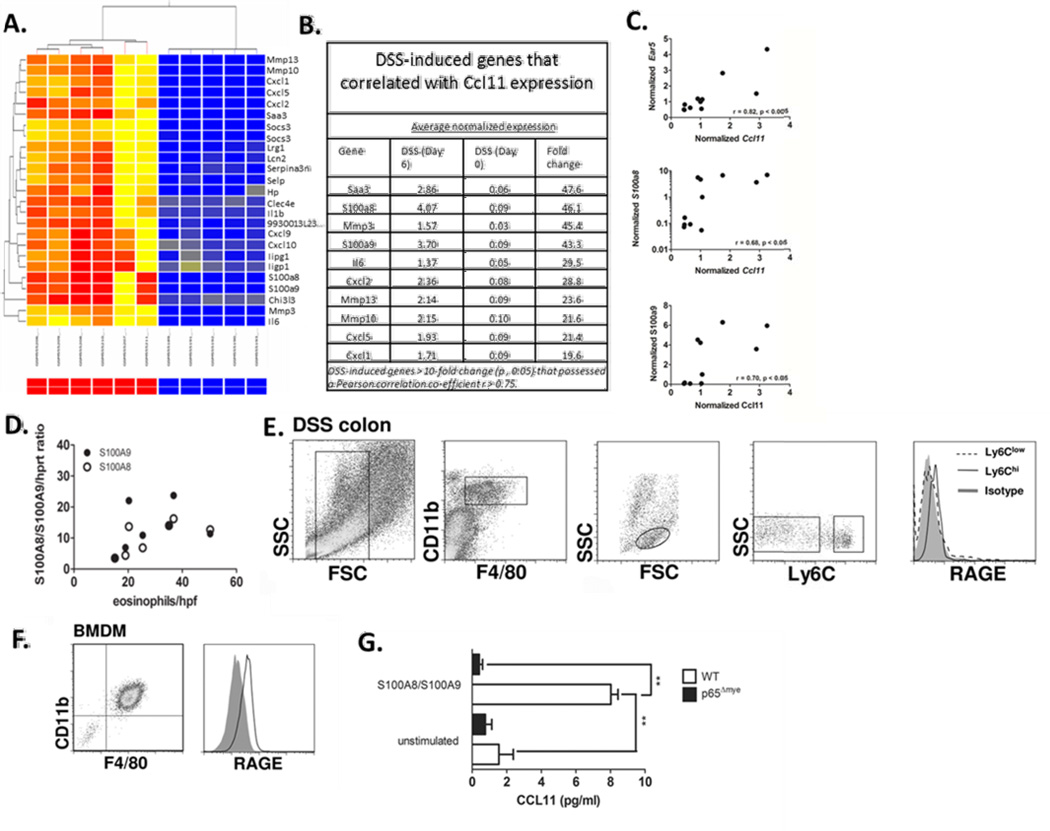
In inflammatory bowel diseases (IBDs), particularly ulcerative colitis, intestinal macrophages (MΦs), eosinophils, and the eosinophil-selective chemokine CCL11, have been associated with disease pathogenesis. MΦs, a source of CCL11, have been reported to be of a mixed classical (NF-κB-mediated) and alternatively activated (STAT-6-mediated) phenotype. The importance of NF-κB and STAT-6 pathways to the intestinal MΦ/CCL11 response and eosinophilic inflammation in the histopathology of experimental colitis is not yet understood. Our gene array analyses demonstrated elevated STAT-6- and NF-κB-dependent genes in pediatric ulcerative colitis colonic biopsies. Dextran sodium sulfate (DSS) exposure induced STAT-6 and NF-κB activation in mouse intestinal F4/80(+)CD11b(+)Ly6C(hi) (inflammatory) MΦs. DSS-induced CCL11 expression, eosinophilic inflammation, and histopathology were attenuated in RelA/p65(Δmye) mice, but not in the absence of STAT-6. Deletion of p65 in myeloid cells did not affect inflammatory MΦ recruitment or alter apoptosis, but did attenuate LPS-induced cytokine production (IL-6) and Ccl11 expression in purified F4/80(+)CD11b(+)Ly6C(hi) inflammatory MΦs. Molecular and cellular analyses revealed a link between expression of calprotectin (S100a8/S100a9), Ccl11 expression, and eosinophil numbers in the DSS-treated colon. In vitro studies of bone marrow-derived MΦs showed calprotectin-induced CCL11 production via a p65-dependent mechanism. Our results indicate that myeloid cell-specific NF-κB-dependent pathways play an unexpected role in CCL11 expression and maintenance of eosinophilic inflammation in experimental colitis. These data indicate that targeting myeloid cells and NF-κB-dependent pathways may be of therapeutic benefit for the treatment of eosinophilic inflammation and histopathology in IBD.


Conflict of interest statement

Disclosures: S.P.H. is a consultant for Immune Pharmaceuticals. The other authors have declared that they have no conflict of interest.

Figures

Figure 1
Figure 1. Eosinophil recruitment and CCL11 expression are STAT-6-independent in DSS-induced colitis
A, Representative flow cytometry plots of F4/80+CD11b+Ly6Chi colonic MΦs and representative histograms of phospho-STAT-6 expression in DSS-treated WT mice (open histogram) compared to STAT-6−/− mice (filled histogram) and mean fluorescence intensity of phospho-STAT-6. B, Histological score. C, Representative photomicrographs of H&E-stained colonic sections from baseline and DSS-treated mice (day 7, 2.5% DSS). D, Eosinophil levels in the colon and E, representative photomicrographs of anti-MBP-stained colonic sections from baseline and DSS-treated mice (day 7, 2.5% DSS). F, CCL11 levels in punch biopsy supernatants from WT and STAT-6−/− mice at baseline and following 5 days of DSS. (A). Data represents the mean ± SEM of n = 3–7 mice per group from duplicate experiments. (B-F) Data represents the mean ± SEM of n = 5–6 mice per group. Data is representative of triplicate experiments. Significant differences (*p<0.05; **p<0.01; ***p<0.001) between groups.
Figure 2
Figure 2. Specificity of RelA/p65 deletion in RelA/p65Δmye mice
A, Representative flow cytometry plots and histograms of phospho-RelA/p65 expression in F4/80+CD11b+Ly6Chi colonic MΦs from DSS-treated WT (open histogram) and RelA/p65Δmye mice (filled histogram). B. Quantification of Nfkbia expression from Ly6Chi MΦs/monocytes sorted from the peripheral blood or colon of DSS-treated mice. Data represent the mean ± SEM of n = 5 mice per group. Representative western blot analysis of WT (+) and RelA/p65Δmye (−) (C) BMDMs stimulated with 1 ug/mL LPS for 1 hour, (D), colonic epithelium and spleen of total RelA/p65 and/or phospho-RelA/p65. E, representative western blot analysis of IKKα, IκBα, IκBβ, c-Rel, p105 and actin expression in BMDMs stimulated with LPS for indicated times (minutes). F, WT and RelA/p65Δmye BMDMs were stimulated for 24 hours with vehicle or 1 ug/mL LPS and levels of IL-6, TNF-α, IL-1β, NO2 and IL-12p40 were measured in the supernatants. G, Representative flow cytometry plots and graph of BMDMs stimulated for 24 hours with control, IL-4 or IFN-γ + LPS and assessed for active caspase-3. (F and G) Data represent the mean ± SEM of n = 3 individual samples per group. (A, C, E–G) Data is representative of duplicate experiments. Significant differences (*p<0.05**, p < 0.01; ***p < 0.001) between groups.
Figure 3
Figure 3. DSS-induced colitis is attenuated in RelA/p65Δmye mice
A, Percent weight change and (B) Disease activity index (DAI) of WT and p65Δmye mice following DSS exposure. C, colon lengths D, representative photomicrographs and (E) quantitative histological score of H&E-stained colonic sections from of WT and p65Δmye mice following 7 days of DSS exposure. F, Cytokine Profile of colonic punch biopsy samples from WT and p65Δmye mice following DSS-exposure. Data represent the mean ± SEM of n = 3–5 mice per group. Data is representative of triplicate (A–E) and duplicate (F) experiments. Significant differences (*p < 0.05; **p < 0.01; ***p < 0.001) compared with WT vehicle or as indicated. Magnification of photomicrographs is ×100. n.s. – not significant.
Figure 4
Figure 4. Colonic recruitment of myeloid cells is not impaired in p65Δmye mice
A, Representative flow cytometry plots and B, quantification of the F4/80+CD11b+Ly6Chi MΦ populations from the colon of WT and RelA/p65Δmye mice following 5 days of vehicle (baseline) or DSS exposure. MΦs were initially gated by SSC vs. FSC followed by F4/80+, CD11b+ and Ly6Chi. C, Representative flow cytometry plots and D, quantification of the F4/80CD11bhi neutrophil population from the colon of WT and RelA/p65Δmye mice following 5 days of vehicle (baseline) or DSS exposure. MΦs were initially gated by SSC vs. FSC followed by F4/80 and CD11bhi. B and D, data represents the mean ± SEM of n = 5–6 mice per group and is representative of duplicate experiments. Significant differences (*p < 0.05; ***p < 0.001) between groups. n.s. – not significant.
Figure 5
Figure 5. Lack of induction of CCL11 and eosinophils in RelA/p65Δmye mice during DSS-induced colitis
A, Representative photomicrographs of anti-MBP-stained colonic sections from baseline and DSS-treated mice (day 6, 2.5%) and colonic eosinophil levels in the colon. B, CCL11 levels in punch biopsy supernatants from WT and RelA/p65Δmye mice in vehicle- (baseline) and DSS-treated mice (day 5, 2.5%) Data indicates the mean ± SEM of n = 6–8 mice per group from triplicate experiments. Significant differences (*p < 0.05; ***p < 0.001) between groups. Magnification of photomicrographs is ×100.
Figure 6
Figure 6. Phenotype Ly6Chi colonic MΦs in WT vs. RelA/p65Δmye mice during DSS-induced colonic injury
A, Representative flow cytometry plot of CD11b+Ly6Chi colonic MΦs flow sorted on day 5 of DSS treatment. B, gene expression was analyzed by qRT-PCR. 3–4 mice were pooled per sample from DSS-treated WT and RelA/p65Δmye mice (3–4 samples per group). Data represents the mean ± SEM. Data is representative of duplicate experiments. Significant differences (*p < 0.05; **p < 0.01) between groups. n.s. – not significant.
Figure 7
Figure 7. Relationship between eosinophil-specific gene (Ear5), Ccl11 and Calprotectin (S100a8 and S100a9) expression in DSS-induced colitis
A. Heat map showing the clustering of the top 25 differentially-expressed genes following DSS-induced colitis (day 6 vs. day 0, p < 0.05). B. Top 10 differentially-expressed genes following DSS-induced colitis (day 6 vs. day 0, p < 0.05, fold change > 10) that correlated with Ccl11 expression (r > 0.75). C. Pearson product-moment correlation between normalized microarray expression values of Ear5, S100a8 and S100a9 are plotted against Ccl11 from individual animals. (D) Pearson product-moment correlation between S100a8 and S100a9/Hprt ratio and eosinophils/hpf in the colon of WT C57BL6 mice on day 3, 5 and 7 after DSS exposure. E. Representative flow plots of RAGE expression on (E.) colonic F4/80+ CD11b+ Ly6Chi monocytes/MΦ from DSS-treated mice and (F.) BMMΦ. G. CCL11 levels in supernatants from WT and RelA/p65Δmye BMMΦ following 24 hour stimulation with S100a8/S100a9 complex. G. Data represents the mean ± SEM. Data is representative of duplicate experiments. Significant differences (**p < 0.01) between groups.

Similar articles

Cited by

References

    1. Heinsbroek SE, Gordon S. The role of macrophages in inflammatory bowel diseases. Expert Rev Mol Med. 2009;11:1–19.
    1. Xavier RJ, Podolsky DK. Unravelling the pathogenesis of inflammatory bowel disease. Nature. 2007;448:427–434. - PubMed
    1. Kamada N, Hisamatsu T, Okamoto S, Chinen H, Kobayashi T, Sato T, Sakuraba A, Kitazume MT, Sugita A, Koganei K, Akagawa KS, Hibi T. Unique CD14 intestinal macrophages contribute to the pathogenesis of Crohn disease via IL-23/IFN-gamma axis. J Clin Invest. 2008;118:2269–2280. - PMC - PubMed
    1. Rugtveit J, Haraldsen G, Hogasen AK, Bakka A, Brandtzaeg P, Scott H. Respiratory burst of intestinal macrophages in inflammatory bowel disease is mainly caused by CD14+L1+ monocyte derived cells. Gut. 1995;37:367–373. - PMC - PubMed
    1. Reinecker HC, Steffen M, Witthoeft T, Pflueger I, Schreiber S, MacDermott RP, Raedler A. Enhanced secretion of tumour necrosis factor-alpha, IL-6, and IL-1 beta by isolated lamina propria mononuclear cells from patients with ulcerative colitis and Crohn's disease. Clin Exp Immunol. 1993;94:174–181. - PMC - PubMed

Publication types

MeSH terms

Supplementary concepts