. 2013 May 1;41(10):5382-99.
doi: 10.1093/nar/gkt233. Epub 2013 Apr 5.

Characterization of genome-reduced fission yeast strains

Affiliations

Characterization of genome-reduced fission yeast strains

Mayumi Sasaki et al. Nucleic Acids Res. .

Abstract

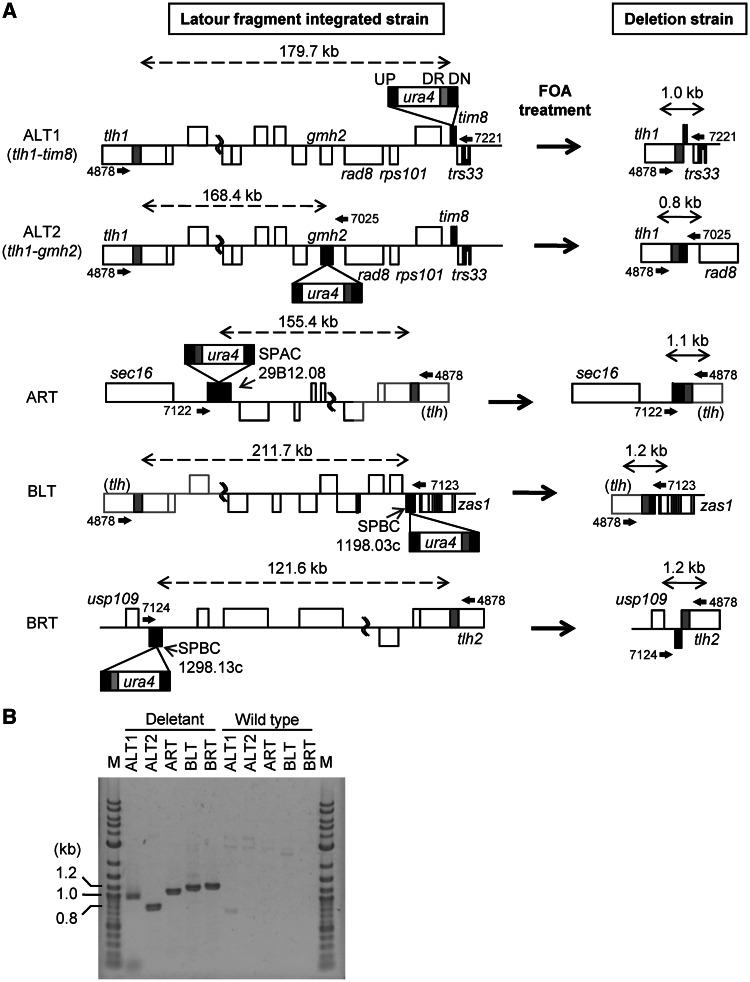
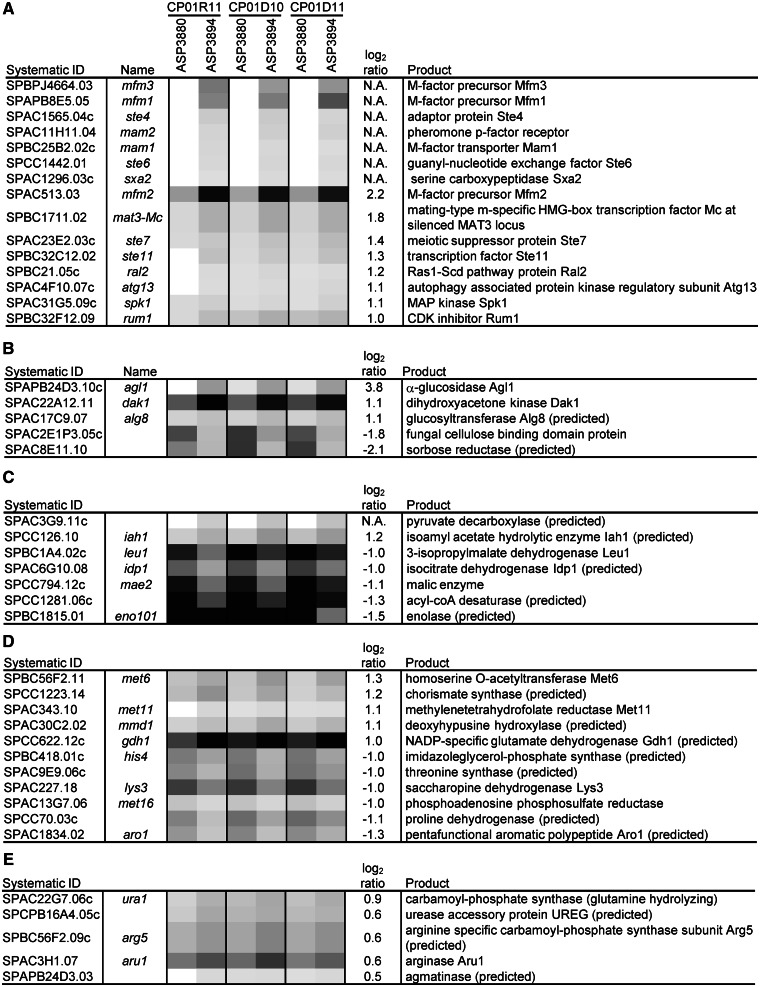
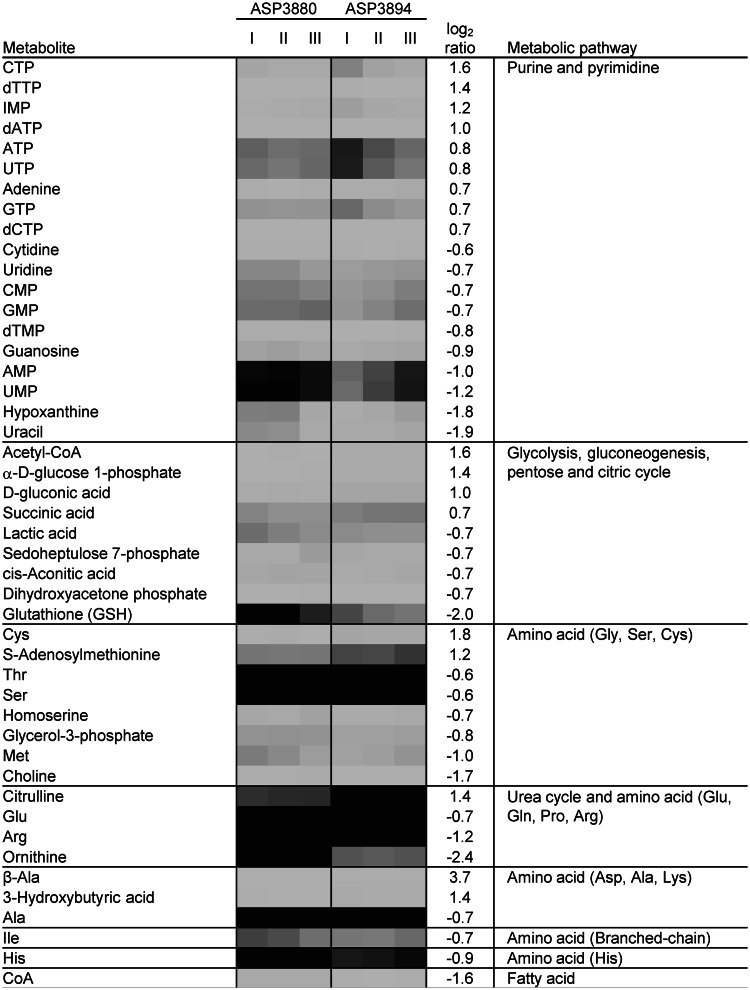
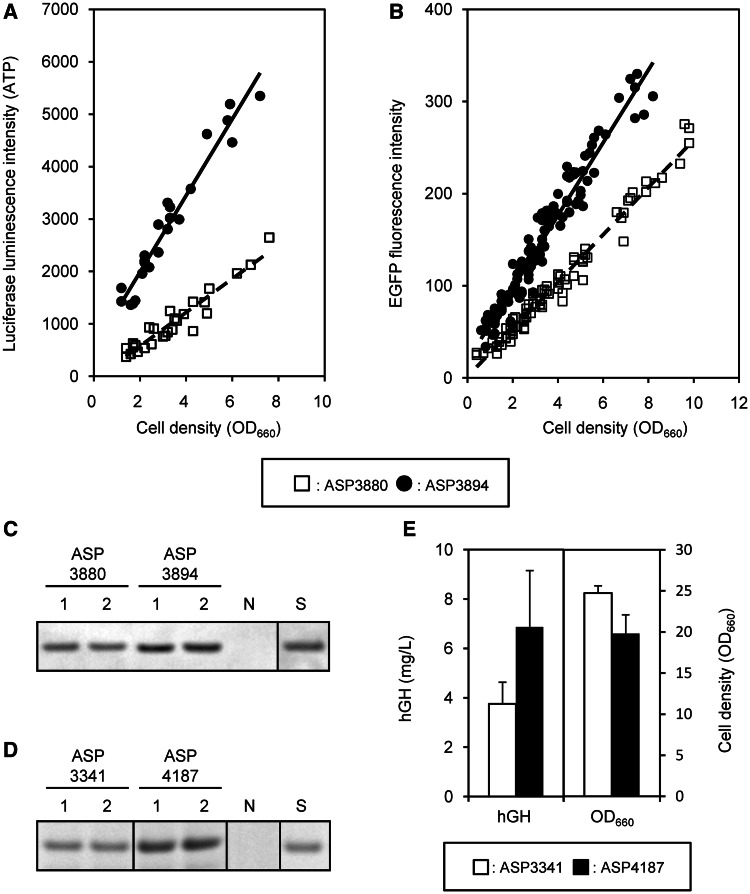
The Schizosaccharomyces pombe genome is one of the smallest among the free-living eukaryotes. We further reduced the S. pombe gene number by large-scale gene deletion to identify a minimal gene set required for growth under laboratory conditions. The genome-reduced strain has four deletion regions: 168.4 kb in the left arm of chromosome I, 155.4 kb in the right arm of chromosome I, 211.7 kb in the left arm of chromosome II and 121.6 kb in the right arm of chromosome II. The deletions corresponded to a loss of 223 genes of the original ~5100. The quadruple-deletion strain, with a total deletion size of 657.3 kb, showed a decreased ability to uptake glucose and some amino acids in comparison with the parental strain. The strain also showed increased gene expression of the mating pheromone M-factor precursor and the nicotinamide adenine dinucleotide phosphate -specific glutamate dehydrogenase. There was also a 2.7-fold increase in the concentration of cellular adenosine triphosphate, and levels of the heterologous proteins, enhanced green fluorescent protein and secreted human growth hormone were increased by 1.7- and 1.8-fold, respectively. The transcriptome data from this study have been submitted to the Gene Expression Omnibus (GEO: http://www.ncbi.nlm.nih.gov/geo/) under the accession number GSE38620 (http://www.ncbi.nlm.nih.gov/geo/query/acc.cgi?token=vjkxjewuywgcovc&acc=GSE38620).


Figures

Figure 1.
Figure 1.
Large-scale deletions of chromosome terminal fragments for genome reduction. (A) Schematic diagrams of large-scale deletions using Latour fragments. The Latour fragment, indicated by the box, consists of four regions: UP, indicated by black box: upstream region of targeted site of recombination for integration of Latour fragment into the chromosome; ura4, indicated by white box: selection marker; DR, indicated by gray box: direct repeat outside of targeted deletion region for homologous recombination by FOA treatment; DN, indicated by black box: downstream region of targeted site of recombination for integration of Latour fragment into the chromosome. Black boxes on each chromosome represent an integration site for the Latour fragment, and the gray box is a direct repeat included in the Latour fragment. Undetermined regions of nucleotide sequence are indicated by gray lines, and they are estimated from the right arm of chromosome II. Arrows above and below the chromosome show primers used to confirm large-scale deletion. Numbers near the arrows give the primer ID. Double-headed dashed arrows show the length of the targeted deletion region, and double-headed solid arrows show the length after the large-scale deletion by FOA treatment. (B) Electrophoresis of DNA to confirm large-scale deletion. The fragments generated after deletion of terminal regions were confirmed by direct colony PCR from deletion strains using primers described in Figure 1A. In the wild-type strain, the distances between primer pairs were >120 kb; therefore, no fragment was detected. M: 2-log DNA ladder (New England Biolabs, Ipswich, MA, USA).
Figure 2.
Figure 2.
Growth properties affected by genome reduction. (A) Maximum specific growth rates (μmax) of the genome-reduced strains. The ura4+ strains were generated by reintroducing ura4+ into ura4-D18 strains. (B) Recovery of growth efficiency by reintroduction of a predicted uracil transporter. SPBC1683.05 (IGF816) and SPBC1683.06c (IGF817), including intergenic regions between upstream and downstream genes, were integrated between leu1-32 and top2 using a leu1 selection marker. (C) Maximum cell density and cell number of the genome-reduced strains. The strains were cultured in YES medium. The values of the highest cell density and cell number during culture were defined as the maximum cell density and the maximum cell number, respectively. The cell densities were measured with a 96-well plate reader, and the cell numbers were measured using a hemocytometer.
Figure 3.
Figure 3.
Cell morphology, nutrient uptake properties and ethanol production of the genome-reduced strains. (A) Cells were visualized under an Olympus BX50 microscope equipped with an UPlanFL ×40 objective lens and WH 10 × 22 eyepiece. DAPI fluorescence images were collected using a DAPI-specific filter set. (B) Glucose consumption, ethanol production and growth curves of ASP3880 and ASP3894 cultured in EMM medium. The linear graphs of glucose consumption and ethanol production were drawn using average values of five independent cultures, estimated by linear approximations (Supplementary Figure S4 and Supplementary Table S3 show details). (C) Sensitivity to amino acid analogs. Cultures of the genome-reduced strains were serially diluted 10-fold, and 3 µl of dilute solution was spotted on the plates. The plates were incubated at 32°C for 5 days. Canavanine, 60 mg/l; thialysine, 200 mg/l; ethionine, 100 mg/l.
Figure 4.
Figure 4.
Change of gene expression and metabolite in glycolytic pathway. The gene expression level and metabolite concentration of ASP3894 were compared with ASP3880. These data, except for ethanol, were obtained from transcriptome analysis and metabolome analysis. The ethanol concentrations were measured by an enzyme electrode sensor BF-5 (Figure 3B). Gene name is shown in color filled box. Metabolite name is shown without box. The colors represent increased or decreased levels of gene expression and metabolite: blue, decrease; green, equal; magenta, increase; black, not detected; gray, deletion gene in ASP3894. The log2 ratio (ASP3894/ASP3880) is shown near the gene or metabolite (N.C. = not calculated.). The parenthetical number indicates P-value of three independent transcriptome or metabolome analyses. Non-indicated genes and metabolites in the glycolytic pathway showed no significant change in comparison of ASP3894 with ASP3880.
Figure 5.
Figure 5.
Gene expression profile of the quadruple-deletion strain in the logarithmic phase. Gene expression levels were determined by transcriptome analysis, and the quadruple-deletion strain ASP3894 was compared with the parental strain ASP3880. Total RNA was extracted from three independent logarithmic phase cultures (OD660 = 5.0) of each strain. The transcriptome analysis was performed three times using each total RNA. Numbers above the strain numbers are serial numbers of each transcriptome analysis. The genes with expression levels that were reproducibly changed were categorized using the GO biological process. (A–D) a gene list of change in log2 ratio more than ±1; (E) more than ±0.5. Gray shading indicates fluorescence intensity of Cy 5 (ASP3880) or Cy 3 (ASP3894). Dark gray and white indicate high- and low-fluorescence intensity, respectively. The log2 ratios are the average of three transcriptome analyses, and N. A. indicates not available, as no fluorescence intensity in either strain. (A) Conjugation with cellular fusion (GO:0000747), (B) carbohydrate metabolic process (GO:0005975), (C) generation of precursor metabolites and energy (GO:0006091), (D) cellular amino acid metabolic process (GO:0006520) and (E) nitrogen cycle metabolic process (GO:0071941).
Figure 6.
Figure 6.
Metabolite profile of the quadruple-deletion strain in logarithmic phase growth. Cells were harvested from three different logarithmic phase cultures (OD660 = 5.0) of each strain. Cellular metabolite mass was estimated by CE–TOFMS analysis, and the quadruple-deletion strain ASP3894 was compared with the parental strain ASP3880. The metabolites for which mass levels had changed in a log2 ratio of more than ±0.5 between ASP3880 and ASP3894 were categorized by each metabolic pathway. The log2 ratio is the average of three independent analyses. The gray shading indicates cellular metabolite concentration. The dark gray indicates high metabolite concentration and the light gray indicates low-metabolite concentration.
Figure 7.
Figure 7.
ATP concentration and heterologous protein production in the quadruple-deletion strain. (A) Time-dependent ATP concentrations were measured by luciferase analysis in six independent EMM cultures, and they were plotted to the intersection graph of luciferase intensity with cell density OD660. (B) Time-dependent EGFP production levels were measured by EGFP fluorescence analysis in ∼20 independent EMM cultures, and they were plotted to the intersection graph of EGFP fluorescence with cell density OD660. (C) EGFP production level in logarithmic phase (OD660 = 5.0) in two independent YPD cultures was measured by western blot and densitometric analysis. S: 2 ng of EGFP standard, N: ARC032 as negative control. (D) Secreted hGH in two independent YPD culture supernatant after 4 days was detected by SDS–PAGE analysis. S: 0.4 μg of hGH standard, N: ARC032 as negative control. (E) Average hGH concentration and cell density OD660 of six independent YPD (pH 6.0 buffering) cultures are shown. The hGH concentration was determined by densitometric analysis of hGH signals on a SDS–PAGE gel against hGH standard protein. The P-value is 0.028 for hGH concentration.

Similar articles

Cited by

References

    1. Medema MH, van Raaphorst R, Takano E, Breitling R. Computational tools for the synthetic design of biochemical pathways. Nat. Rev. Microbiol. 2012;10:191–202. - PubMed
    1. Fujio T. Minimum genome factory: innovation in bioprocesses through genome science. Biotechnol. Appl. Biochem. 2007;46:145–146. - PubMed
    1. Moya A, Gil R, Latorre A, Pereto J, Pilar Garcillan-Barcia M, de la Cruz F. Toward minimal bacterial cells: evolution vs. design. FEMS Microbiol. Rev. 2009;33:225–235. - PMC - PubMed
    1. Posfai G, Plunkett G, Feher T, Frisch D, Keil GM, Umenhoffer K, Kolisnychenko V, Stahl B, Sharma SS, de Arruda M, et al. Emergent properties of reduced-genome Escherichia coli. Science. 2006;312:1044–1046. - PubMed
    1. Mizoguchi H, Sawano Y, Kato J, Mori H. Superpositioning of deletions promotes growth of Escherichia coli with a reduced genome. DNA Res. 2008;15:277–284. - PMC - PubMed

Publication types

Associated data