. 2014 Mar 6;33(10):1218-28.
doi: 10.1038/onc.2013.82. Epub 2013 Apr 8.

An evolutionary shift in the regulation of the Hippo pathway between mice and flies

Affiliations

An evolutionary shift in the regulation of the Hippo pathway between mice and flies

W Bossuyt et al. Oncogene. .

Abstract

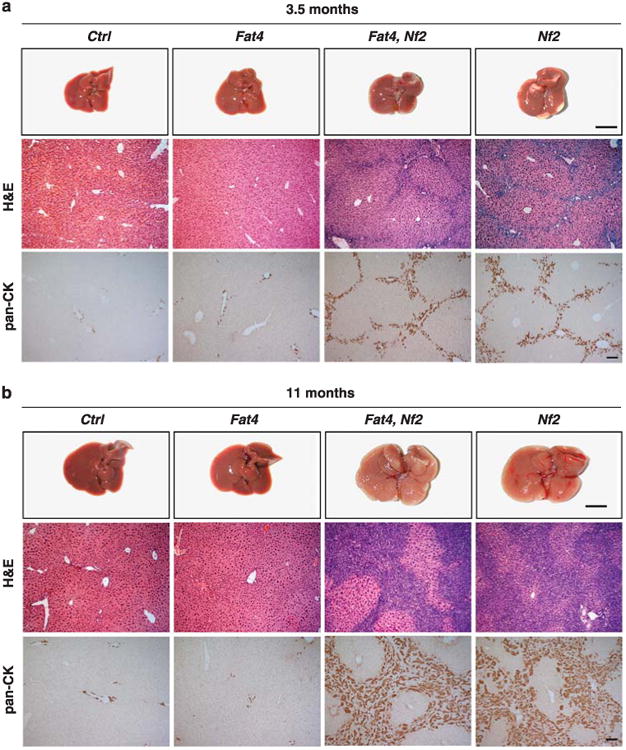
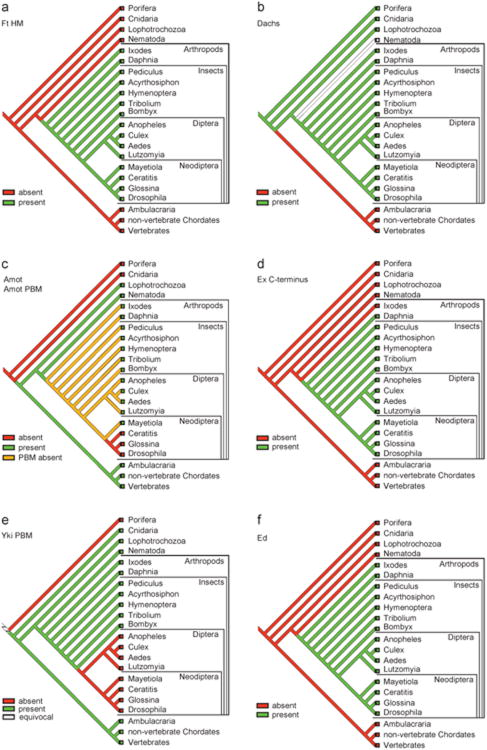
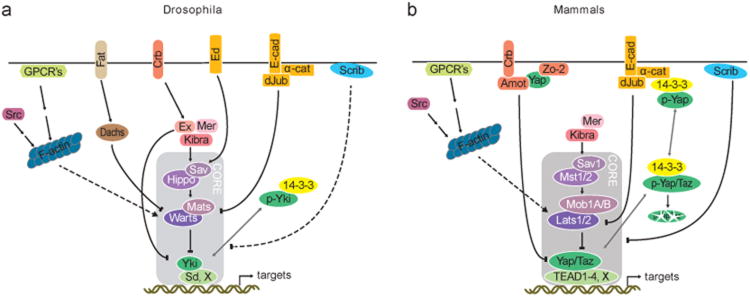
The Hippo pathway plays a key role in controlling organ growth in many animal species and its deregulation is associated with different types of cancer. Understanding the regulation of the Hippo pathway and discovering upstream regulators is thus a major quest. Interestingly, while the core of the Hippo pathway contains a highly conserved kinase cascade, different components have been identified as upstream regulators in Drosophila and vertebrates. However, whether the regulation of the Hippo pathway is indeed different between Drosophila and vertebrates or whether these differences are due to our limited analysis of these components in different organisms is not known. Here we show that the mouse Fat4 cadherin, the ortholog of the Hippo pathway regulator Fat in Drosophila, does not apparently regulate the Hippo pathway in the murine liver. In fact, we uncovered an evolutionary shift in many of the known upstream regulators at the base of the arthropod lineage. In this evolutionary transition, Fat and the adaptor protein Expanded gained novel domains that connected them to the Hippo pathway, whereas the cell-adhesion receptor Echinoid evolved as a new protein. Subsequently, the junctional adaptor protein Angiomotin (Amot) was lost and the downstream effector Yap lost its PDZ-binding motif that interacts with cell junction proteins. We conclude that fundamental differences exist in the upstream regulatory mechanisms of Hippo signaling between Drosophila and vertebrates.


Conflict of interest statement

Conflict of Interest: The authors declare no conflict of interest.

Figures

Figure 1
Figure 1
Fat mutant livers do not show a Hippo-like phenotype. Gross Images, hematoxylin and eosin (H&E) and pan-CK staining of livers from wild-type control, Alb-Cre; Fat4flox/flox, Alb-Cre; Fat4flox/flox; Nf2flox/flox and Alb-Cre; Nf2flox/flox at (a) 3.5 months of age or (b) 11 months of age. Gross images show that Nf2 mutants and Nf2 Fat4 double mutants developed comparable hepatomegaly and bile duct hamartomas at the surface of the liver, whereas Fat4 mutant livers were normal. Scale bar=1cm. H&E and pan-CK staining showed comparable bile duct overproliferation in Nf2 mutant and Nf2; Fat4 double mutant livers. Scale bar=100μm.
Figure 2
Figure 2
ftsum mutants display overgrowth and activation of Yki-activity readouts, but no planar cell polarity phenotypes. (a and b) Third instar wing discs in (a) heterozygous ftsum or (b) homozygous ftsum mutants, (c and d) Third instar eye discs in (c) heterozygous ftsum mutants or (d) homozygous ftsum mutants, (e) diap1-lacZ expression (red and gray, e′) in eye discs containing ft422 mutant clones marked by the absence of GFP expression, (f) diapl-lacZ expression (red and gray, f′) in eye discs containing ftsum mutant clones marked by the absence of GFP expression, (g-j) Pharate adult abdomen to analyze planar cell polarity phenotypes by hair orientation in (g) wild-type, (h) ft422/ftfd mutant, (i) ft422/ftfd mutant with act-Gal4-driven expression of FtFL and, (j) ftsum mutant animals, (k and I) Third instar wing discs with ft422 or ftsum clones respectively to analyze planar cell polarity by analyzing photoreceptor R4 location marked by m∂-lacZ expression (red) and ELAV (blue) to mark all photoreceptor cells. Mutant clones are marked by the absence of GFP expression (green), (k′I′) The orientation of rhabdomers is indicated by green arrows for wild-type tissue and red arrows for mutant tissue, (m and n) Dachs stainings in third instar wing discs. D (red and gray, m′ and n′) has a proximodistal sub-cellular localization in wild-type cells marked by GFP expression (green), (m) ftG–rv null mutant clones, marked by the absence of GFP, show mislocalization of D around the cell circumference and increased D levels, (n) ftsum mutant clones, marked by the absence of GFP, show increased D levels but normal localization.
Figure 3
Figure 3
Amino-acid residues 4834-4899 in the intracellular domain of Fat are essential for its tumor suppressor function in Drosophila melanogaster. (a) Graphical representation of the different UAS-Ft constructs (left) and the phenotypes upon expression in a ft mutant background. Rescue of lethality was assayed by act-gal4-driven expression in ft422/ftG–rv trans-heterozygotes. Wing size (Supplementary Figure S4), wing disc size (Supplementary Figure S5) and PCP phenotypes in the abdominal hairs (Supplementary Figure S6) were analyzed in the same genotype. Analysis of ex-lacZ expression was analyzed by hh-Gal4-induced expression in ft422/ftfd trans-heterozygotes. * in the Ft3only construct indicates the use of f]-lacZ. (b-e) Bright-field images of third instar wing imaginal disc of (b) wild-type, (c) ft422/ftG–rv trans-heterozygotes, (d) ft422/ftG–rv discs with act-Gal4-driven expression of full-length Ft and (e) ft422/ftG–rv discs with act-Gal4-driven expression of UAS-FtΔ3. (f-j) The ex-lacZ expression (red and gray, h′, i′, j′) in wing discs of (f) hh-Cal4, (g) ft422/ftG–rv, (h) ft422/ftG–rv, hh-Gal4, UAS-FfFL, (i) ft422/ftG–rv, hh-Gal4, UAS-FtDECD and (j) ft422/ftG–rv, hh-Gal4, UAS-FtD3 third instar larva, (k) The hs-Flp ft422clones, DE-Gal4, UAS-Ft30nly eye discs showing Ff422 clones marked by the absence of GFP (green and gray, k″), showing fj-lacZ (red and gray, k′). The Ft3only construct is marked by an HA tag (blue, gray, k‴).
Figure 4
Figure 4
Phylogenetic distribution of Hippo pathway components. Phylogenetic trees represent different phyla and specific species in arthropods, (a) Fat gains a Hippo signaling interaction motif at the base of arthropods, (b) D is lost in the lineage that gives rise to arthropods. (c) Angiomotin originates at the base of bilateria and is lost in the neodiptera lineage, (d) The Yorkie C-terminal PDZ-binding motif (PBM) originates at the base of eumetazoans and is lost in diptera. (e) Ed is present only in arthropods, (f) Ex gains a C-terminal Hippo signaling interaction domain in the arthropod lineage.
Figure 5
Figure 5
Simplified representations of Hippo pathway regulation in Drosophila and mammals, (a) Graphical representation of identified Hippo pathway components in Drosophila melanogaster (b) and in mammals. In both graphical representations, solid lines indicate direct interactions and gray lines indicate changes in subcellular localization.

References

    1. Pan D. The hippo signaling pathway in development and cancer. Dev Cell. 2010;19:491–505. - PMC - PubMed
    1. Halder G, Johnson RL. Hippo signaling: growth control and beyond. Development. 2011;(138):9–22. - PMC - PubMed
    1. Zhao B, Li L, Lei Q, Guan KL. The Hippo-YAP pathway in organ size control and tumorigenesis: an updated version. Genes Dev. 2010;24:862–874. - PMC - PubMed
    1. Genevet A, Tapon N. The Hippo pathway and apico-basal cell polarity. Biochem J. 2011;436:213–224. - PubMed
    1. Sebe-Pedros A, Zheng Y, Ruiz-Trillo la, Pan D. Premetazoan origin of the hippo signaling pathway. Cell Reports. 2012;1:13–20. - PMC - PubMed

Publication types

MeSH terms