. 2013 Jul;74(1):11-8.
doi: 10.1038/pr.2013.58. Epub 2013 Apr 5.

Intra-amniotic LPS amplifies hyperoxia-induced airway hyperreactivity in neonatal rats

Affiliations
Free PMC article

Intra-amniotic LPS amplifies hyperoxia-induced airway hyperreactivity in neonatal rats

Chang Won Choi et al. Pediatr Res. 2013 Jul.
Free PMC article

Retraction in

Abstract

Background: We previously showed that intra-amniotic lipopolysaccharide (LPS) amplifies alveolar hypoplasia induced by postnatal hyperoxia. We determined whether the priming effect of intra-amniotic LPS amplifies hyperoxia-induced airway hyperreactivity (AHR).

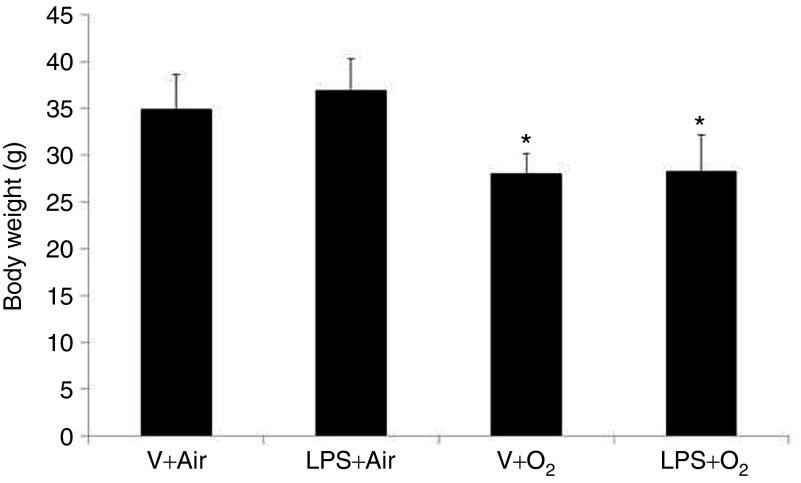
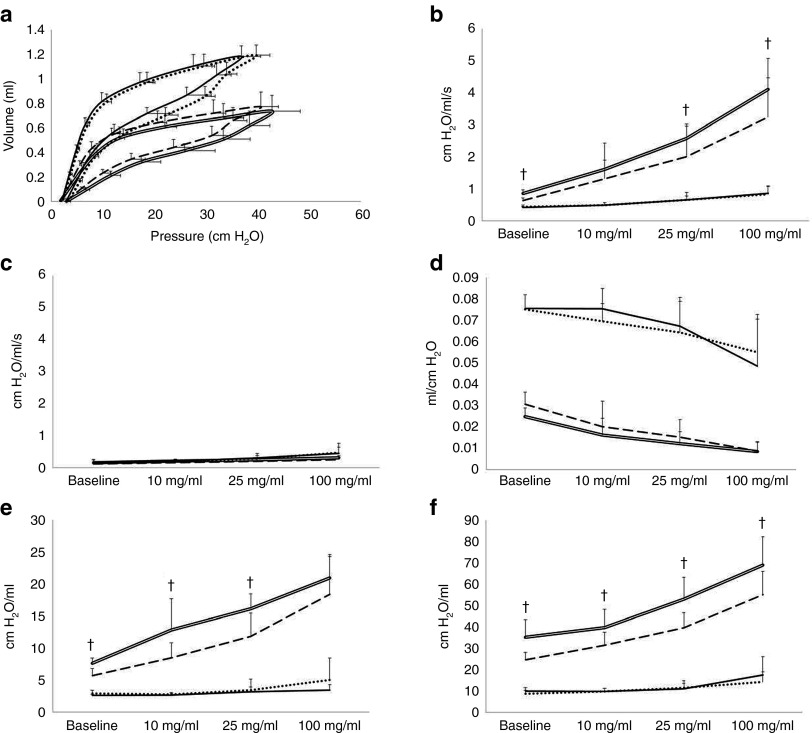
Methods: LPS or normal saline was injected into the amniotic cavities of pregnant rats at the 20th day of gestation. After birth, rat pups were exposed to 60% O₂ or air for 14 d. On postnatal day 14, rat pups underwent forced oscillometry, which included a challenge with nebulized methacholine, and the lungs were harvested for morphological studies.

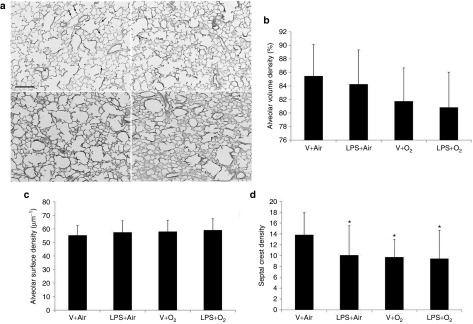
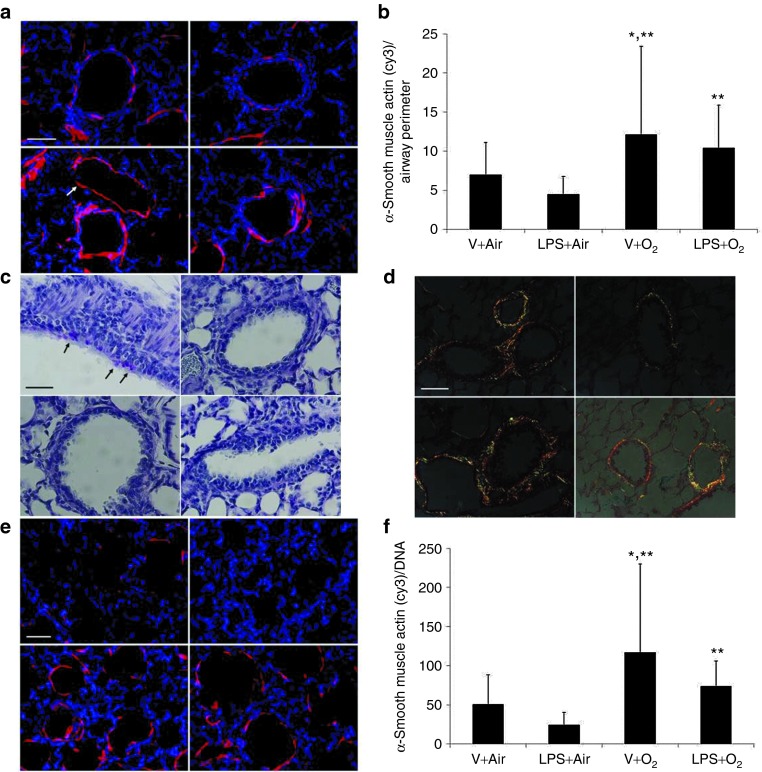
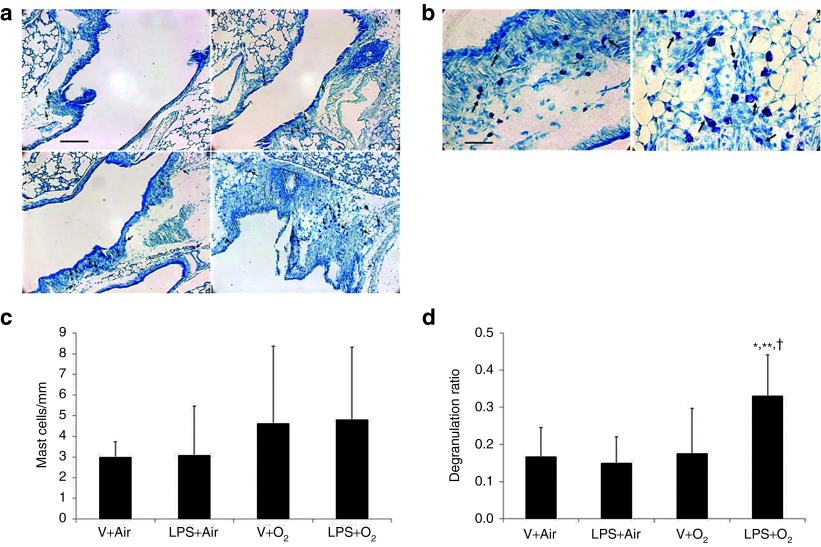
Results: Hyperoxia significantly increased airway reactivity and decreased compliance. Intra-amniotic LPS further increased hyperoxia-induced AHR but did not further impair respiratory system compliance. Hyperoxia-induced changes in lung parenchymal and small airway morphology were not further altered by intra-amniotic LPS. However, combined exposure to intra-amniotic LPS and hyperoxia increased the proportion of degranulating mast cells in the hilar airways.

Conclusion: Intra-amniotic LPS amplified postnatal hyperoxia-induced AHR. This was associated with increased airway mast cell degranulation, which has previously been linked with hyperoxia-induced AHR. There were no morphologic changes of parenchyma or airways that would account for the LPS augmentation of hyperoxia-induced AHR.


Figures

Figure 1
Figure 1
Group body weights on day 14. Data are based on animals that survived to day 14. Body weights in the hyperoxia-exposed groups (V+O2 and LPS+O2) were significantly lower than those of the air-exposed groups (V+Air and LPS+Air). No significant difference in body weight was present between hyperoxia-exposed groups or between air-exposed groups. Data are the mean ± SD (eight per group). *P < 0.05 vs. V+Air group. LPS, lipopolysaccharide; V, vehicle.
Figure 2
Figure 2
Effects of intra-amniotic LPS or vehicle plus postnatal air or hyperoxia exposure on respiratory system mechanics at postnatal day 14. Four experimental groups are shown by solid line (V+Air), dotted line (LPS+Air), dashed line (V+O2), and double line (LPS+O2). (a) The pressure–volume loops of the individual groups. (b) Total respiratory system resistance in response to increasing methacholine challenges. (c) Newtonian (large airway, low-frequency oscillation) respiratory system resistance demonstrating lack of treatment effect on methacholine provocation. (d) Compliance, (e) tissue damping, and (f) tissue elastance were significantly greater in the hyperoxia-exposed groups than in the air-exposed groups. Within the hyperoxia-exposed groups, the LPS+O2 group had significantly greater tissue damping and tissue elastance than the V+O2 group. Data are the mean ± SD (eight per group). P < 0.05 vs. V+O2 group. LPS, lipopolysaccharide; V, vehicle.
Figure 3
Figure 3
Effects of intra-amniotic LPS or vehicle plus postnatal air or hyperoxia exposure on alveolar development at postnatal day 14. (a) Representative photomicrographs of rat lungs on day 14 showing that hyperoxia-exposed groups had markedly larger and simpler airspaces and thicker airspace walls than air-exposed groups. Top left: V+Air; top right: LPS+Air; bottom left: V+O2; bottom right: LPS+O2. Arrows in the V+Air panel denote septal tips. Original magnification ×100. Bar = 200 μm. (b) Alveolar volume density, which estimates alveolar number, was significantly decreased by postnatal hyperoxia without additive effect of prenatal LPS. (c) Alveolar surface density estimating alveolar surface area did not significantly differ among the groups. (d) Septal crest density (crests/alveolar volume density) was significantly decreased in the V+O2, LPS+Air, and LPS+O2 groups as compared with the V+Air group but did not differ significantly among V+O2, LPS+Air, and LPS+O2 groups. Stained with modified Hart's elastin. Data are the mean ± SD (eight per group). *P < 0.05 vs. V+Air group. LPS, lipopolysaccharide; V, vehicle.
Figure 4
Figure 4
Effects of intra-amniotic LPS or vehicle plus postnatal air or hyperoxia exposure on peribronchial and alveolar α-smooth muscle actin (α-SMA) at postnatal day 14. (a,e) Immunofluorescent photomicrographs of rat lungs on day 14 for α-SMA show α-SMA (red) staining around (a) small airways and (e) alveoli of individual groups. Top left: V+Air; top right: LPS+Air; bottom left: V+O2; bottom right: LPS+O2. DNA dye Hoechst 33342 (blue; Pierce Biotechnology, Rockford, IL) was used as counterstaining. Peribronchial α-SMA staining is differentiated from alveolar α-SMA staining by the presence of the cells (epithelial cells) inside the α-SMA staining. Arrow in the V+O2 panel indicates α-SMA staining around blood vessel. (b) Fluorescence intensity of α-SMA normalized to airway perimeter was increased in the hyperoxia-exposed groups, with no effect of prenatal LPS. (c) Periodic acid-Schiff (PAS)–stained photomicrographs are shown. PAS positivity represents epithelial mucous metaplasia. Top left: V+Air; top right: LPS+Air; bottom left: V+O2; bottom right: LPS+O2. A very small number of PAS-positive cells was observed only in the large (>200 μm) airways of the V+Air group (arrows). PAS-positive cells were not identified in either large airways or small airways in the other treatment groups. (d) Picrosirius red–stained photomicrographs obtained from polarized microscope are shown. Top left: V+Air; top right: LPS+Air; bottom left: V+O2; bottom right: LPS+O2. Greater illumination around small airways indicating more peribronchial collagen deposition was seen in hyperoxia-exposed groups than in air-exposed groups. However, no discernible difference in peribronchial illumination was observed between V+O2 and LPS+O2 groups. (f) Fluorescence intensity of α-SMA normalized to DNA (Hoechst 33342) was increased in the hyperoxia-exposed groups with no effect of prenatal LPS. Original magnification ×400. Bar = 50 μm. Data are the mean ± SD (eight per group). *P < 0.05 vs. V+Air group. **P < 0.05 vs. LPS+Air group. LPS, lipopolysaccharide; V, vehicle.
Figure 5
Figure 5
Effects of intra-amniotic LPS or vehicle plus postnatal air or hyperoxia exposure on mast cell accumulation and degranulation in hilar airways. (a) Toluidine blue–stained photomicrographs are shown. Top left: V+Air; top right: LPS+Air; bottom left: V+O2; bottom right: LPS+O2. Arrows indicate mast cells (not all the mast cells are indicated). Mast cells were located in the lamina propria, submucosa, and peribronchial adventitia and interstitium of hilar airways. (b) Degranulating mast cells in the hilar airways in the hyperoxia-exposed animals are indicated by arrows. Left: V+O2, right: LPS+O2. (c) Mast cell accumulation in the hilar airways was not significantly different among the treatment groups. (d) Mast cell degranulation ratio was significantly greater in the LPS+O2 group than in the other treatment groups. Original magnification: (a) ×100, (b) ×400. Bar: (a) 200 μm, (b) 50 μm. Data are the mean ± SD (eight per group). *P < 0.05 vs. V+Air group. **P < 0.05 vs. LPS+Air group. P < 0.05 vs. V+O2 group. LPS, lipopolysaccharide; V, vehicle.

Comment in

  • Findings of Research Misconduct.
    [No authors listed] [No authors listed] Fed Regist. 2019 Nov 7;84(216):60097-60098. Fed Regist. 2019. PMID: 37547121 Free PMC article. No abstract available.

Similar articles

Cited by

References

    1. Van Marter LJ, Dammann O, Allred EN, Developmental Epidemiology Network Investigators et al. Chorioamnionitis, mechanical ventilation, and postnatal sepsis as modulators of chronic lung disease in preterm infants. J Pediatr. 2002;140:171–6. - PubMed
    1. Choi CW, Kim BI, Hong JS, Kim EK, Kim HS, Choi JH. Bronchopulmonary dysplasia in a rat model induced by intra-amniotic inflammation and postnatal hyperoxia: morphometric aspects. Pediatr Res. 2009;65:323–7. - PubMed
    1. Husain AN, Siddiqui NH, Stocker JT. Pathology of arrested acinar development in postsurfactant bronchopulmonary dysplasia. Hum Pathol. 1998;29:710–7. - PubMed
    1. Tomashefski JF, Jr, Oppermann HC, Vawter GF, Reid LM. Bronchopulmonary dysplasia: a morphometric study with emphasis on the pulmonary vasculature. Pediatr Pathol. 1984;2:469–87. - PubMed
    1. Robin B, Kim YJ, Huth J, et al. Pulmonary function in bronchopulmonary dysplasia. Pediatr Pulmonol. 2004;37:236–42. - PubMed

Publication types

Substances

LinkOut - more resources