. 2013 Nov;27(11):2209-19.
doi: 10.1038/leu.2013.103. Epub 2013 Apr 8.

p190-B RhoGAP regulates the functional composition of the mesenchymal microenvironment

Affiliations

p190-B RhoGAP regulates the functional composition of the mesenchymal microenvironment

R Raman et al. Leukemia. 2013 Nov.

Abstract

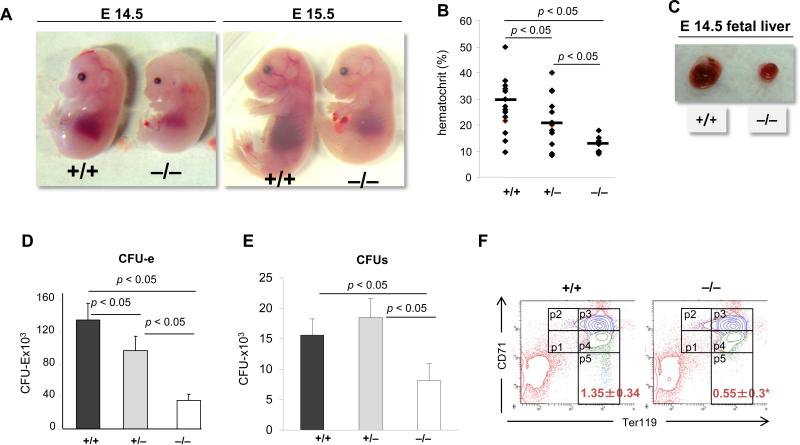
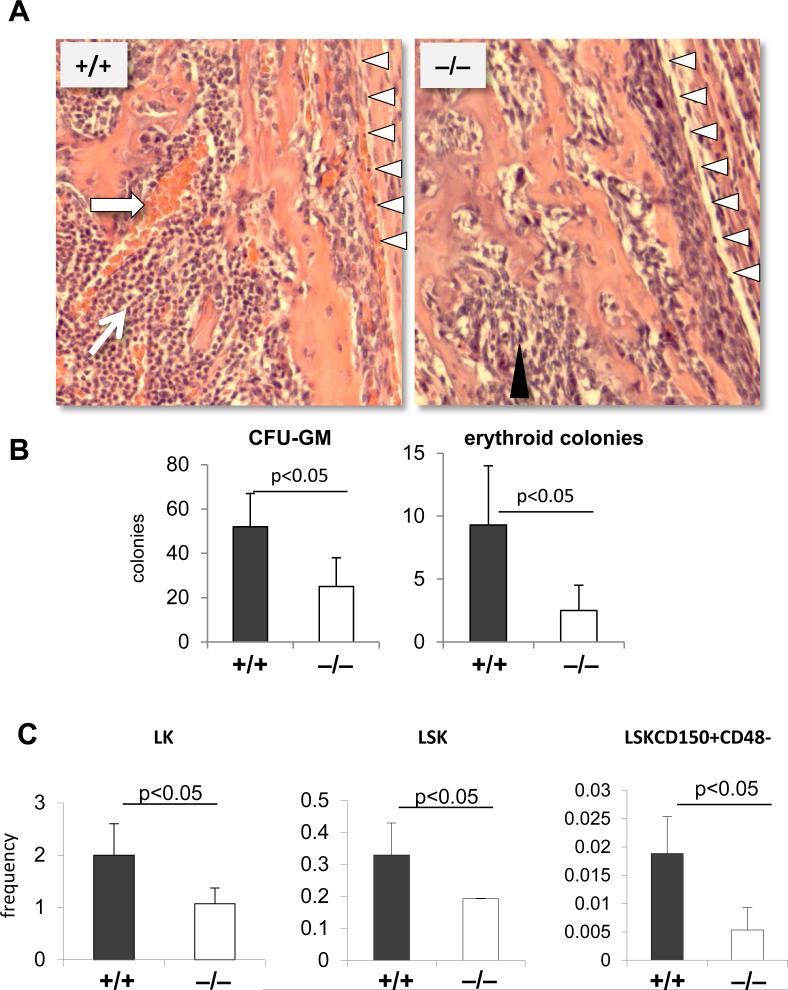
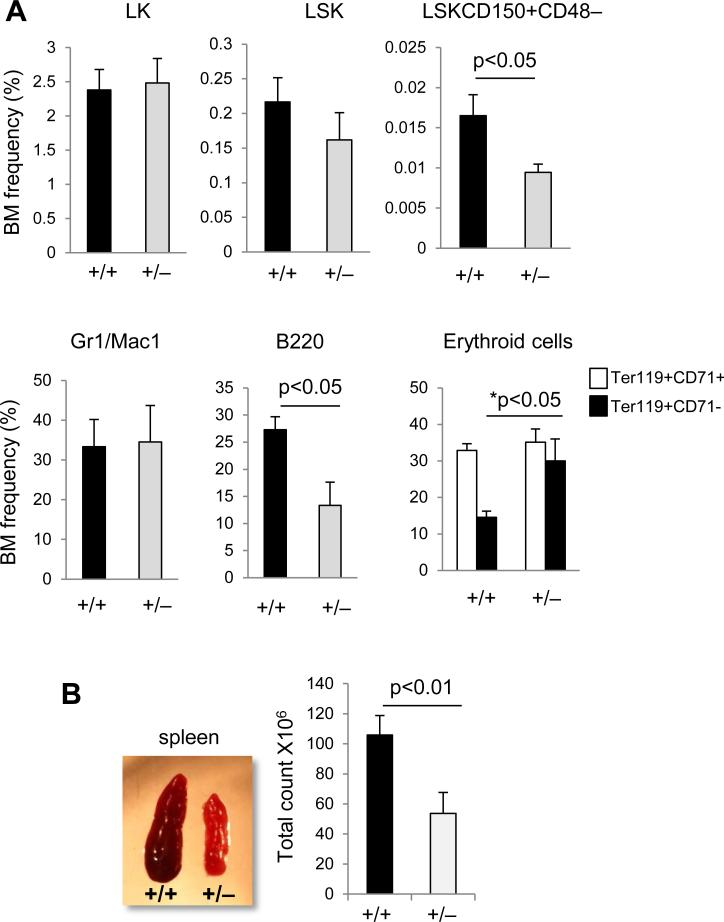
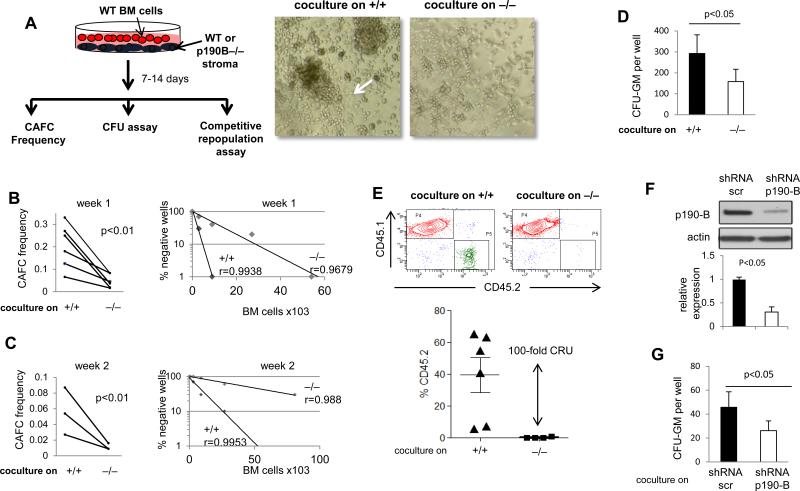
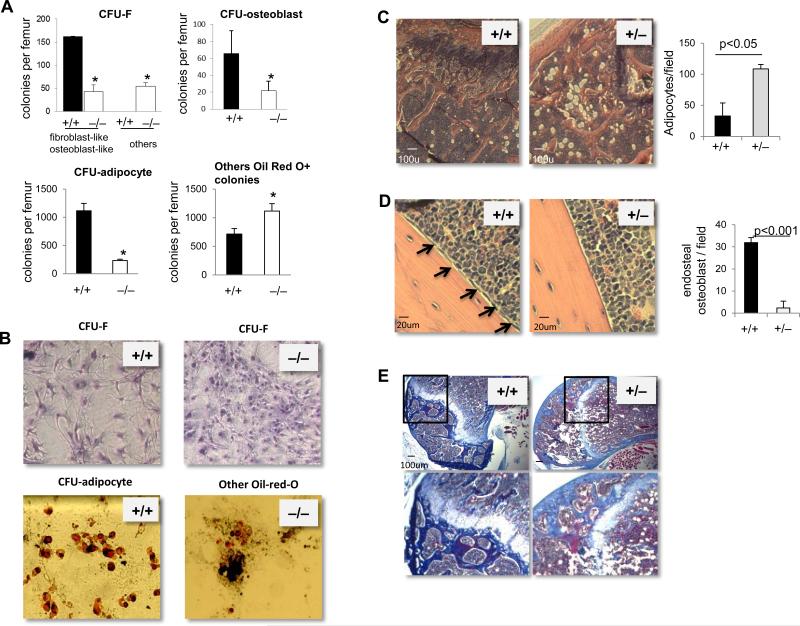
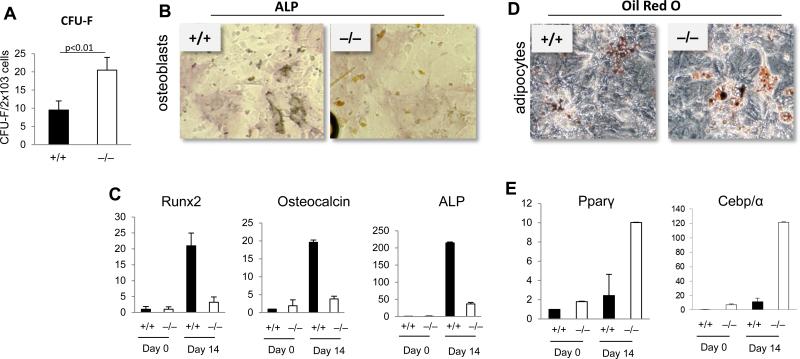
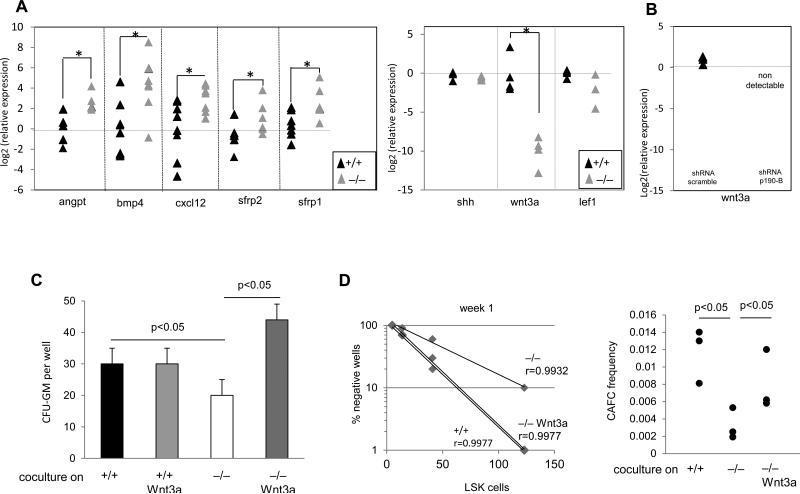
Hematopoiesis is regulated by components of the microenvironment, so-called niche. Here, we show that p190-B GTPase-activating protein (p190-B) deletion in mice causes hematopoietic failure during ontogeny, in p190-B(-/-) fetal liver and bones, and in p190-B(+/-) adult bones and spleen. These defects are non-cell autonomous, as we previously showed that transplantation of p190-B(-/-) hematopoietic cells into wild-type (WT) hosts leads to normal hematopoiesis. Coculture of mesenchymal stem (MSC)/progenitor cells and wild-type bone marrow (BM) cells reveals that p190-B(-/-) MSCs are dysfunctional in supporting hematopoiesis owing to impaired Wnt signaling. Furthermore, p190-B loss causes alteration in BM niche composition, including abnormal colony-forming unit (CFU)-fibroblast, CFU-adipocyte and CFU-osteoblast numbers. This is due to altered MSC lineage fate specification to osteoblast and adipocyte lineages. Thus, p190-B organizes a functional mesenchymal/microenvironment for normal hematopoiesis during development.


Figures

Figure 1
Figure 1. Fetal liver hematopoietic defects in p190-B−/− embryos
(A) Images of embryonic day14.5 and day 15.5. (B) Hematocrit of peripheral blood of e14.5 embryos. (C) Pictures of fetal liver of e14.5 embryos. (D&E) Fetal liver cells were plated in methylcellulose with EPO and SCF. Colonies were scored at day 2 for CFU-e (D) and day 7 for CFU-mix (E). Histogram is total number of colonies per liver (mean±SD, n=8). (F) Representative flow cytometry chart of fetal liver erythroid differentiation profile assessed by Ter119 and CD71 expression profile, P1: Ter119lowCD71low; P2: Ter119lowCD71high; P3: Ter119highCD71high; P4: Ter119highCD71Int; P5: Ter119highCD71low see supplemental table 1 for quantifications.
Figure 2
Figure 2. Bone marrow hematopoietic defects in p190-B−/− embryos
(A) H&E staining of fetal bone section at e18.5. Arrows point to hematopoietic clusters, black arrow heads point to non-hematopoietic cells, white arrow heads points to endosteal bone region (n=4). (B) Total number of CFU-GM and BFU-E colonies per e18.5 bone (mean±SD, n=4). (C) Frequency of LT-HSC, LSK and LK within CD45+ fraction of e18.5 bone marrow (mean±SD, n=5).
Figure 3
Figure 3. Hematopoietic defects in ten percent of p190-B haploinsufficient adult mice
Ten percent of p190-B haploinsufficient adult mice live shortly and develop brain hemorrhage and hematopoietic abnormalities. Hematopoietic lineages of these animals was analyzed and compared to age-matched WT controls. (A) Frequency of LT-HSC, progenitors (LSK and LK), granulo-monocytic cells (Gr-1+CD11b+), B cell (B220+) and erythroid lineages (Ter119+CD71+, Ter119+CD71-) in BM (mean±SD, n=8). (B) Images of spleen of WT and p190-B+/− adult mice that live shortly. Histogram is total number of cells per spleen, (mean±SD, n=5).
Figure 4
Figure 4. Defective hematopoietic supportive activity of p190-B−/− FL stromal cells
Coculture of WT bone marrow cells on WT and p190-B stroma in cobblestone area-forming cell (CAFC) conditions. (A) Schema of experiments and representative picture of cocultures taken at day 7. Arrow points to a CAFC on WT stroma. (B&C) CAFC frequency at week 1 (B) and week 2 (C) of co-culture. Each paired dots represents one experiment, n=5 independent experiment each performed with independently derived stroma. The right panel represents the percent of negative wells per number of bone marrow cells cocultured on each stroma. CAFC were enumerated at light microscopy; one representative experiment is shown. (D) Analysis of colony formation ability after one week of coculture on each stroma (mean±SD, 3 independent stroma). (E) Repopulation potential of hematopoietic cells following one week co-culture with each stroma, assessed by competitive repopulation assay. Representative CD45.2 and CD45.1 analysis in the peripheral blood by flow cytometry. Histogram is frequency of CD45.2 in the peripheral blood at 4 month following transplantation. mean±SD, n=6, 2 independent experiments performed with independent stromal cells. (F) Representative Western blot showing p190-B expression in WT MSCs after lentiviral infection with control shRNA (Scramble) or an shRNA targeting p190-B (shRNA p190-B). Actin was used as a loading control. (G) Numbers of CFU-GM recovered from one week coculture on WT stroma infected with ShRNA scramble or shRNA-p190-B (mean±SD, 3 lentiviral infections of independent stroma, lentiviral infection was performed in duplicate each time).
Figure 5
Figure 5. Mesenchymal/stromal-derived lineage defects in p190-B−/− FL embryos
(A) CFU-F, CFU-osteoblasts and CFU-adipocytes per femur of e18.5 WT and p190-B−/− embryos. (mean±SD, n=3). (B) Representative images of CFU-F and CFU-adipocyte colonies from each genotypes. *p<0.05. (C&D) Representative micrograph of decalcified longitudinal femoral section of WT and p190-B+/− mice stained with Haematoxylin and eosin.(C) Images show adipocytes in head of femur. Histogram is number of adipocytes per femur head (mean±SD, n=3). (D) Images show endosteal osteoblasts (black arrow). Histogram is number of endosteal osteoblasts per field (mean±SD, from 3 fields per section and in 3 independent femurs). (E) Masson's trichrome staining of decalcified femurs of WT and p190B+/− mice showing collagen deposition (in blue), representative of 3 independent femurs.
Figure 6
Figure 6. Characterization of p190-B-deficient FL MSCs
(A) Number of CFU-F per cultured-derived stromal cells (mean±SD, n=4). (B) Stromal cells were grown under osteoblastic conditions and analyzed for alkaline phosphatase staining. Representative picture of at least 3 independent cultures (C) qPCR analysis of the mRNA expression of osteoblastic genes before and 14 days after induction of differentiation (mean±SD, n=3). (D) Stromal cells were grown under adipocytic conditions and analyzed for Oil-Red O staining. Representative picture of at least 3 independent cultures. (E) qPCR analysis of the mRNA expression of adipocytic genes before and 14 days after induction of differentiation (mean±SD, n=3). *p<0.05
Figure 7
Figure 7. p190-B regulates hematopoietic supportive activity of stroma via Wnt3a
(A) qPCR analysis of the mRNA expression of various genes from independent stromal cells. Data are expressed as log2 fold relative to average of WT samples set to 0, *p<0.05 Mann-Whitney test, n=4-6 samples per group, each triangle represents one independent sample. (B) qPCR analysis of Wnt3a mRNA expression in WT stromal cells infected with sh-RNA scramble and shRNA-p190B, as shown in the figure 4. Log2 fold relative to average of WT –shRNA scramble set to 0. ND: non-detectable. (C) Sorted LSK cells were cocultured on WT and p190B−/− stroma for one week either in presence or absence of recombinant Wnt3a. Total number of CFU-GM colonies recovered from cocultures (mean±SD, 3 independent experiments performed with independent stroma). (D) CAFC frequency after one week in coculture. The right panel represents the percent of negative wells per number of cells cocultured on each stroma; one representative experiment is shown. Left panel is calculated CAFC frequency. Each dot represents one experiment, n=3 independent experiment each performed with independent stroma.

Similar articles

Cited by

References

    1. Shiozawa Y, Havens AM, Pienta KJ, Taichman RS. The bone marrow niche: habitat to hematopoietic and mesenchymal stem cells, and unwitting host to molecular parasites. Leukemia. 2008;22:941–590. - PMC - PubMed
    1. Yin T, Li L. The stem cell niches in bone. J Clin Invest. 2006;116(5):1195–201. - PMC - PubMed
    1. Kiel MJ, Morrison SJ. Uncertainty in the niches that maintain haematopoietic stem cells. Nat Rev Immunol. 2008;8(4):290–301. - PubMed
    1. Mikkola HK, Orkin SH. The journey of developing hematopoietic stem cells. Development. 2006;133(19):3733–44. - PubMed
    1. Caplan AI. Mesenchymal stem cells. J Orthop Res. 1991;9(5):641–50. - PubMed

Publication types

MeSH terms