. 2013 May;123(5):2193-206.
doi: 10.1172/JCI64201. Epub 2013 Apr 8.

Endothelial SRF/MRTF ablation causes vascular disease phenotypes in murine retinae

Affiliations

Endothelial SRF/MRTF ablation causes vascular disease phenotypes in murine retinae

Christine Weinl et al. J Clin Invest. 2013 May.

Abstract

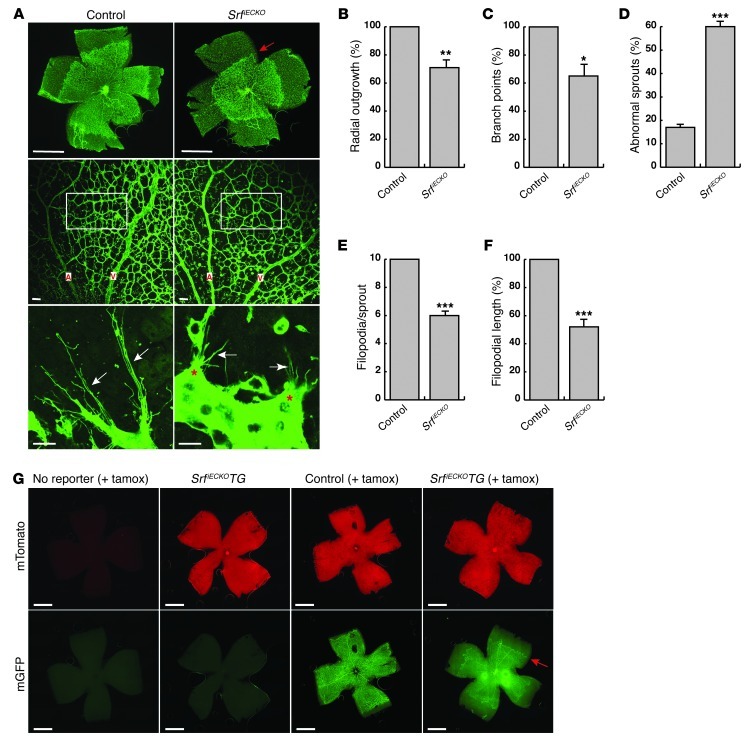
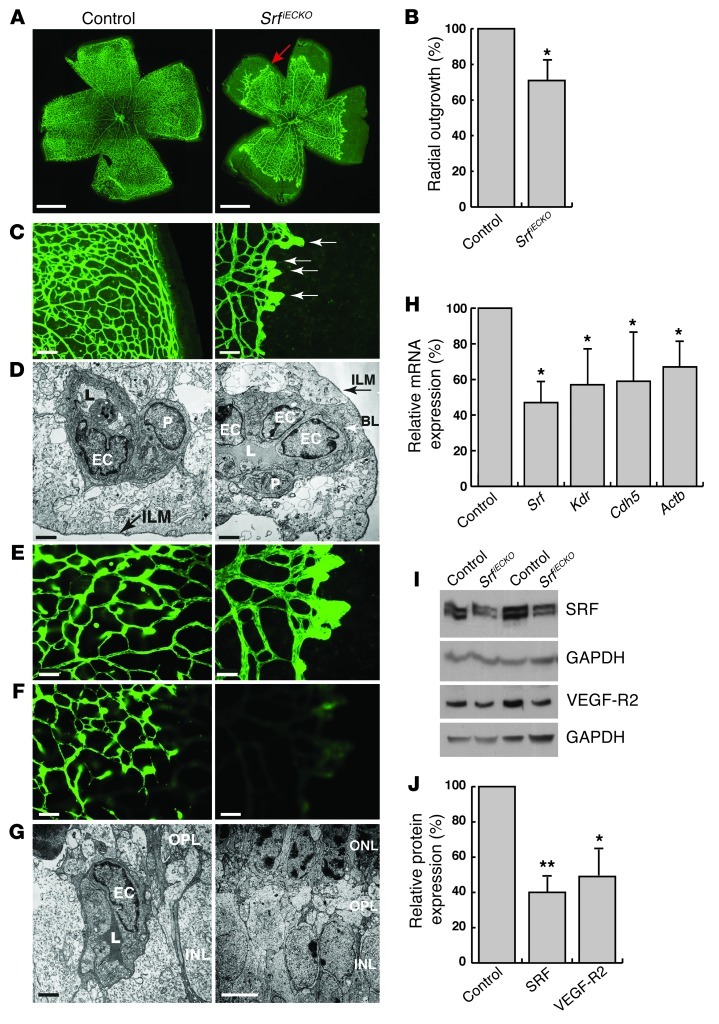
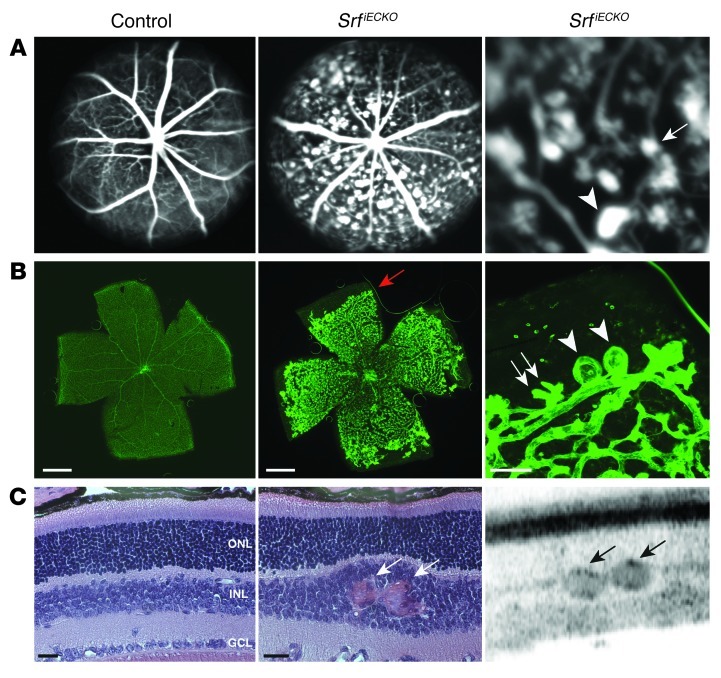
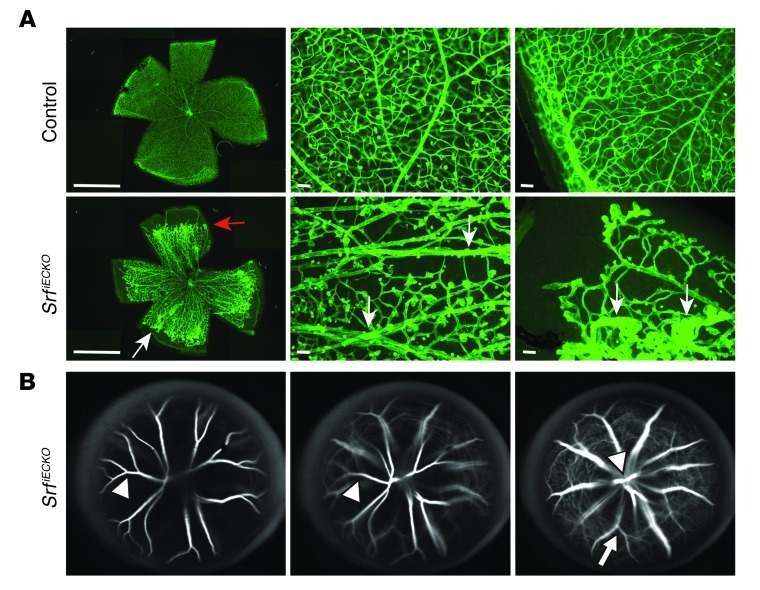
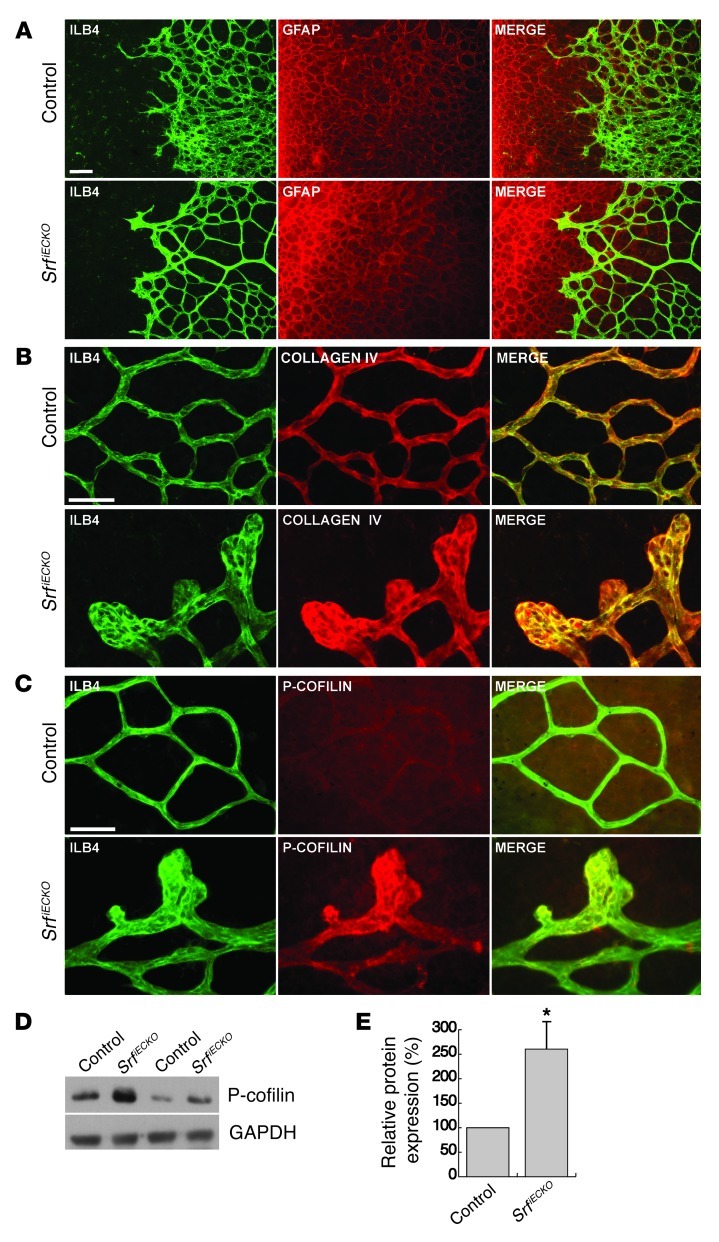
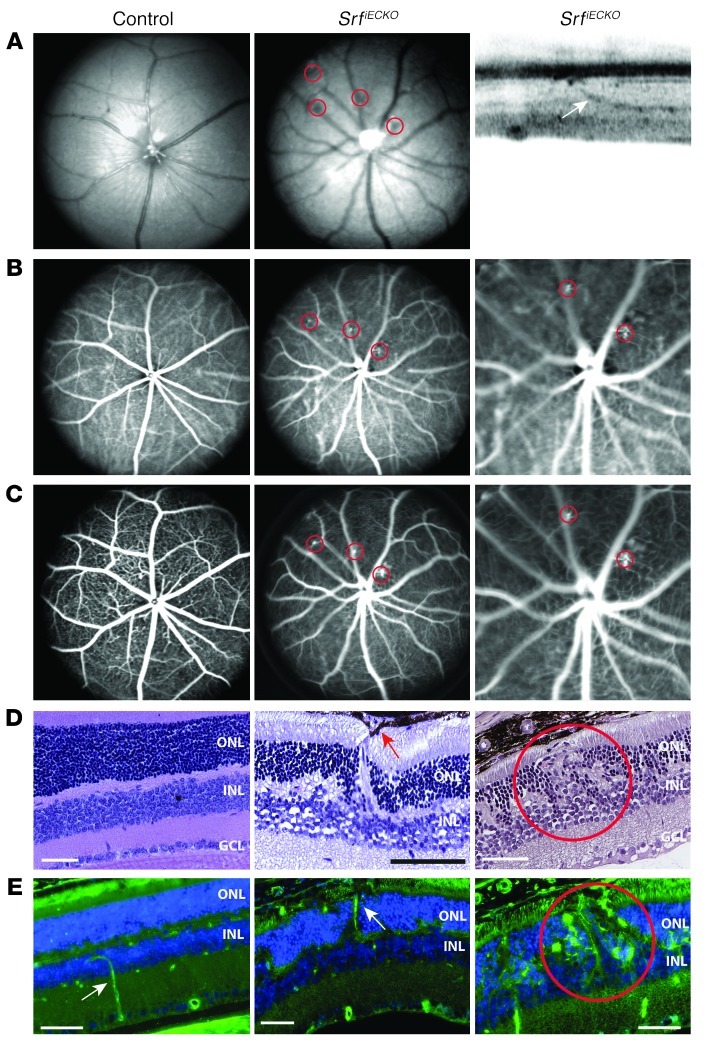
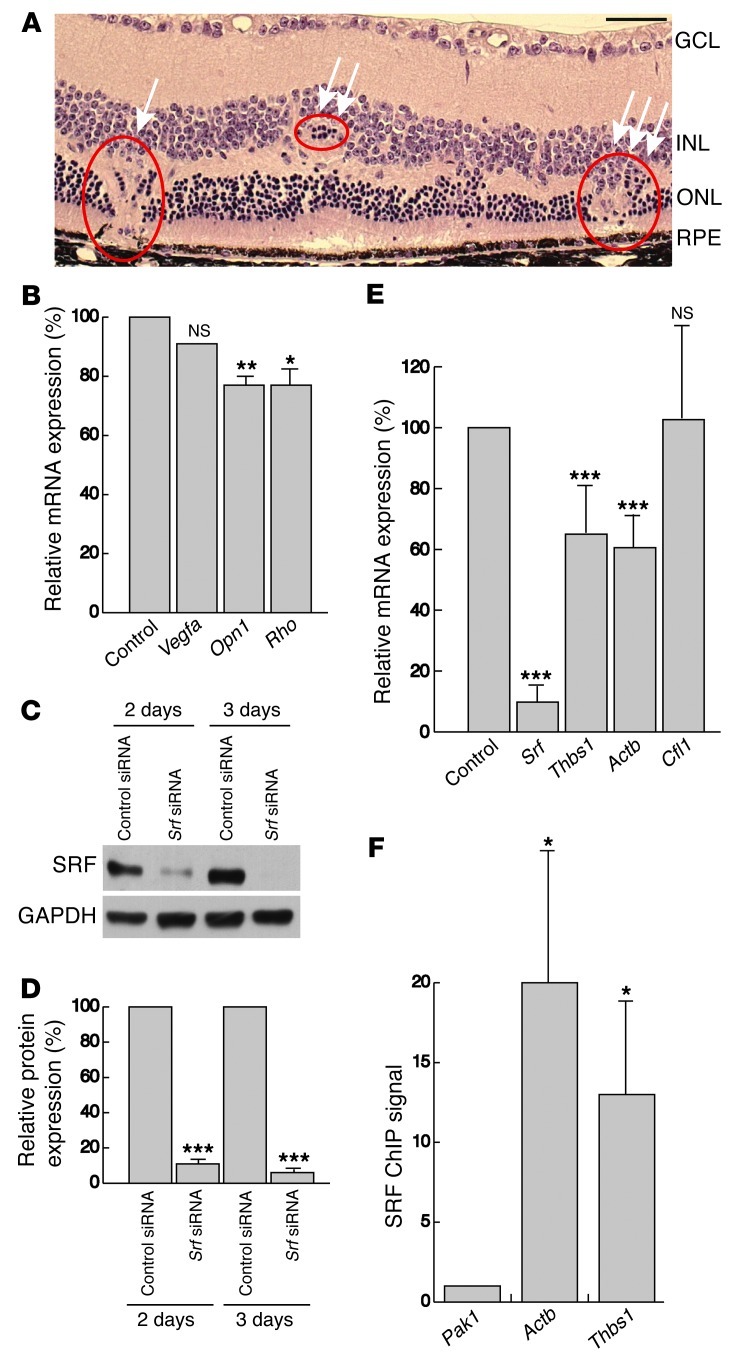
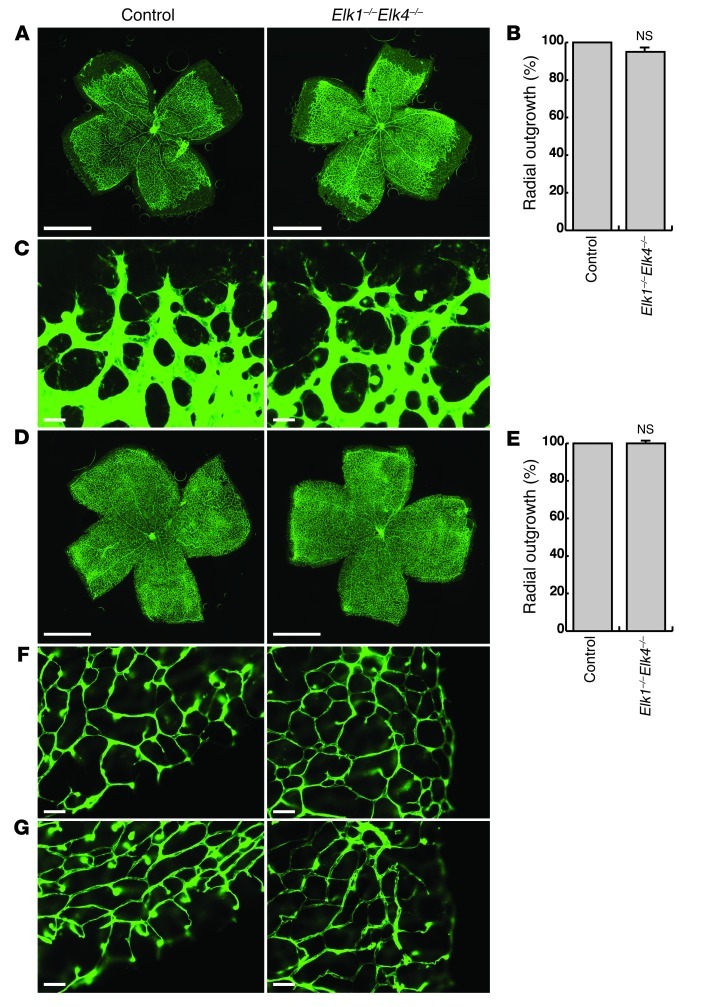
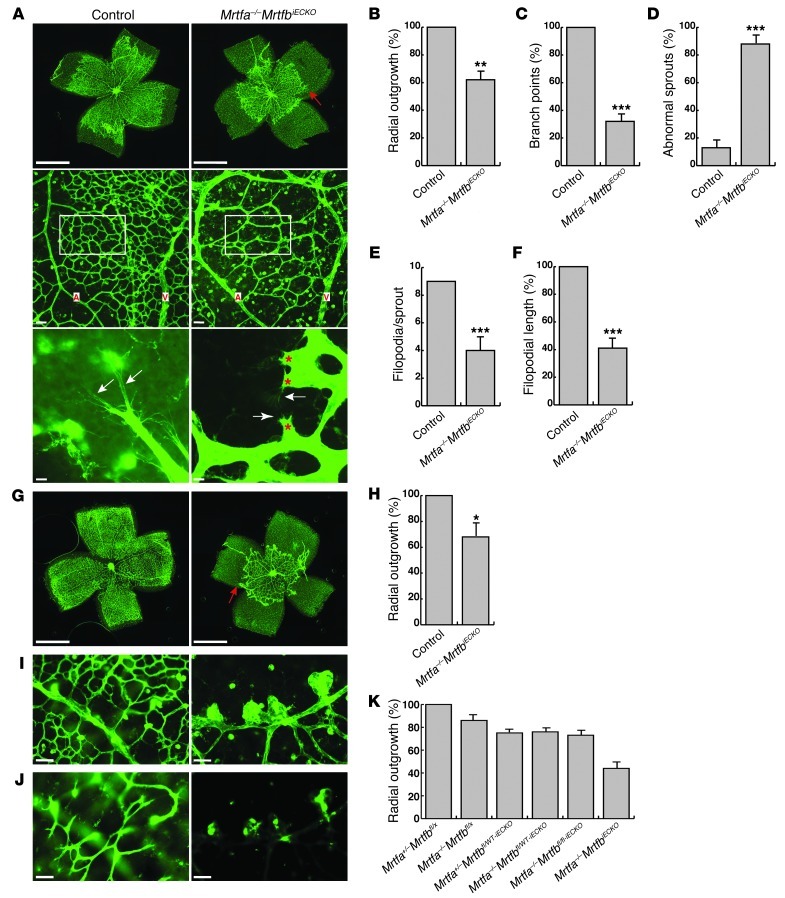
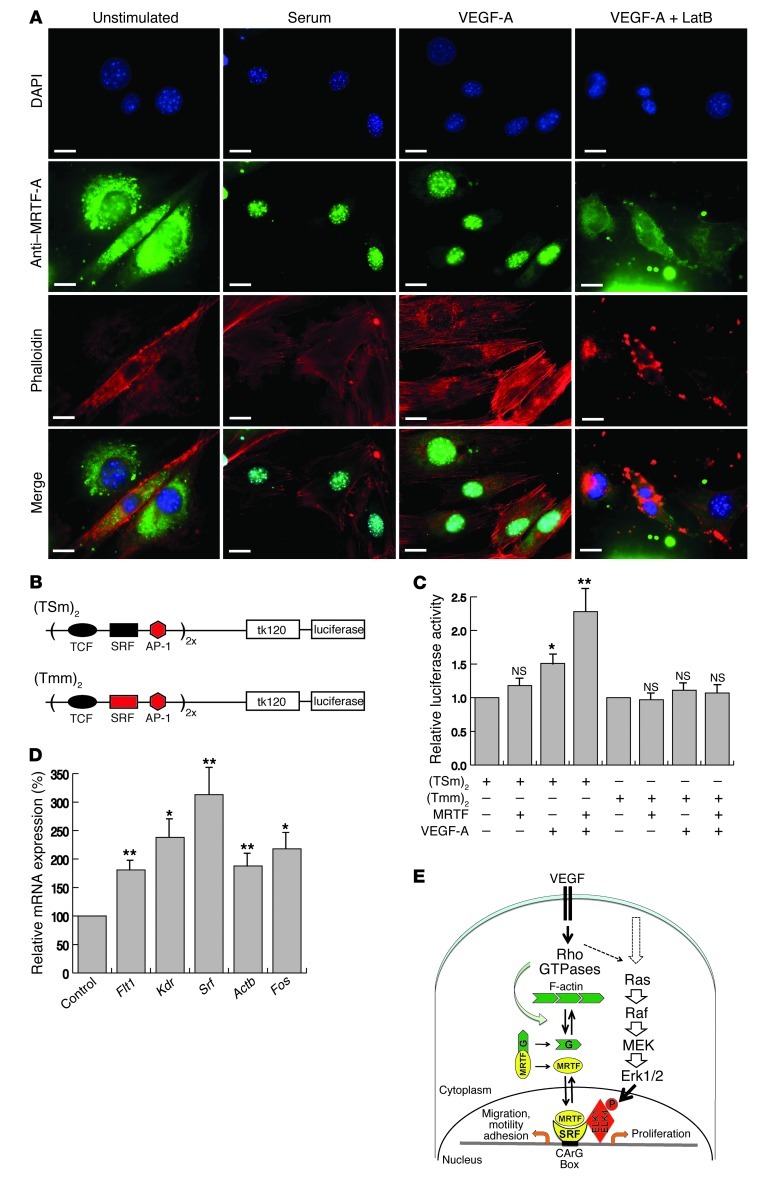
Retinal vessel homeostasis ensures normal ocular functions. Consequently, retinal hypovascularization and neovascularization, causing a lack and an excess of vessels, respectively, are hallmarks of human retinal pathology. We provide evidence that EC-specific genetic ablation of either the transcription factor SRF or its cofactors MRTF-A and MRTF-B, but not the SRF cofactors ELK1 or ELK4, cause retinal hypovascularization in the postnatal mouse eye. Inducible, EC-specific deficiency of SRF or MRTF-A/MRTF-B during postnatal angiogenesis impaired endothelial tip cell filopodia protrusion, resulting in incomplete formation of the retinal primary vascular plexus, absence of the deep plexi, and persistence of hyaloid vessels. All of these features are typical of human hypovascularization-related vitreoretinopathies, such as familial exudative vitreoretinopathies including Norrie disease. In contrast, conditional EC deletion of Srf in adult murine vessels elicited intraretinal neovascularization that was reminiscent of the age-related human pathologies retinal angiomatous proliferation and macular telangiectasia. These results indicate that angiogenic homeostasis is ensured by differential stage-specific functions of SRF target gene products in the developing versus the mature retinal vasculature and suggest that the actin-directed MRTF-SRF signaling axis could serve as a therapeutic target in the treatment of human vascular retinal diseases.


Figures

Figure 1
Figure 1. EC depletion of SRF impairs angiogenesis in P6 murine retinal development.
(A) ILB4-stained retinal flat-mounts of P6 control and SrfiECKO mice. Top: Progression of angiogenic front. Red arrow indicates recessed angiogenic front of the primary plexus in SrfiECKO retinae. Images are composites (see Methods). Middle: Vessel density between artery (A) and vein (V). Bottom: Sprout morphology. White arrows indicate filopodia; red asterisks highlight abnormal morphologies of SrfiECKO tip cells. (B) Quantitation of retinal area covered by blood vessels (radial outgrowth), expressed as percentage of control. n = 6 retinae. (C and D) Quantitation of (C) branch points in a field of view (A, middle, white boxes) and (D) abnormal sprouts. n = 4 retinae. (E and F) Quantitation of (E) filopodial number per sprout and (F) mean length of individual filopodia. n = 30 sprouts (control); 39 sprouts (SrfiECKO). (G) Retinal flat-mounts of P8 mice lacking the double-fluorescent mTmG Cre reporter, Srfflex1/flex1Cdh5(PAC)-CreERT2mTmG mice (SrfiECKOTG), and control Srfflex1/WTCdh5(PAC)-CreERT2mTmG mice. Shown are red fluorescent channel (mTomato) and GFP (mGFP) signals of the same retinae, the latter being obtained upon CreERT2 activation by intragastric tamoxifen injection (+ tamox). Red arrow indicates recessed angiogenic front of the primary plexus in Srfflex1/flex1Cdh5(PAC)-CreERT2mTmG retinae. Images are composites (see Methods). Scale bars: 1 mm (A, top, and G); 50 μm (A, middle); 15 μm (A, bottom). *P < 0.05, **P < 0.01, ***P < 0.001 vs. respective control.
Figure 2
Figure 2. Avascular zones, distal microaneurysms, and lack of deep plexi in SrfiECKO retinae at P10.
(A) ILB4-stained retinal flat-mounts. Red arrow indicates recessed angiogenic front in the SrfiECKO primary plexus. Images are composites (see Methods). (B) Radial outgrowth, expressed as percent of control. n = 19 retinae (control); 9 retinae (SrfiECKO). (C) Higher magnification of ILB4-stained retinal flat-mounts. White arrows indicate microaneurysms in SrfiECKO retinae. (D) EM image of blood vessels near the inner limiting membrane (ILM) to visualize the primary plexus. P, pericyte; L, lumen; BL, basal lamina. (E and F) ILB4-stained retinal capillaries of (E) the primary plexus and (F) deep plexi, which revealed complete absence of deeper capillaries in SrfiECKO retinae. (G) EM image visualizing deep plexi. OPL, outer plexiform layer. (H) Semiquantitative RT-PCR of mRNA expression in purified ECs of P10 retinae. n = 4 (Srf); 3 (Kdr and Actb); 5 (Cdh5). mRNA levels were normalized to Gapdh and expressed as percent of control. (I) Western blot analysis of 2 representative pairs of control and SrfiECKO P10 whole retinal tissue. (J) Quantitation of Western blot. SRF (n = 5) and VEGF-R2 (n = 4) levels were normalized to GAPDH and expressed as percent of control. Scale bars: 1 mm (A), 100 μm (C), 2 μm (D and G, left), 50 μm (E and F), 5 μm (G, right). *P < 0.05, **P < 0.01 vs. respective control.
Figure 3
Figure 3. Vascular abnormalities in SRF-depleted retinae at P17.
(A) SLO FLA of P17 control and SrfiECKO mice. An enlarged view of the middle panel is shown at right (enlarged ×3-fold). (B) ILB4 staining on retinal flat-mounts after SLO imaging (flat-mount preparation included removal of hyaloid vessels). Images are composites (see Methods). Distal microaneurysms of different sizes (white arrows, small; arrowheads, large), as visualized in vivo in A, were also observed by ILB4 staining (see higher-magnification view at right). Red arrow indicates recessed angiogenic front of the primary plexus in SrfiECKO retinae. (C) Visualization of microaneurysms in SrfiECKO retinae by OCT (right) and, subsequently, by H&E staining of paraffin sections (left and middle). In SrfiECKO retinae, erythrocyte-filled microaneurysms were present (white arrows) that caused local displacement of other layers. OCT confirmed this finding to be similarly identifiable in vivo in SrfiECKO retinae (black arrows indicate distal microaneurysms). GCL, ganglion cell layer. Scale bars: 1 mm (B, left and middle); 100 μm (B, right); 25 μm (C).
Figure 4
Figure 4. Impaired regression of hyaloid vessels in SrfiECKO retinae.
(A) ILB4 staining on retinal flat-mounts of P17 control and SrfiECKO retinae, displayed at lower (left; composite images, see Methods) and higher (middle and right) magnification. Flat-mount preparation used conditions to preserve hyaloid vessels. Red arrow indicates retarded angiogenic front; white arrows indicate persistent hyaloid vessels in SrfiECKO retinae. In the central area (middle), all capillary beds and no hyaloids were demonstrated in control retinae, whereas in SrfiECKO retinae, deep plexi were absent, but hyaloids were present. In the periphery (right), control retinae demonstrated complete vascularization, whereas outer avascular zones remained in SrfiECKO retinae, displaying distal microaneurysms and hyaloid vessels. (B) SLO angiography of SrfiECKO eyes revealed the course of hyaloid vessels, from their origin at the retinal center toward the avascular “target zone” in the periphery, via tracing on 3 different focal planes of the same eye (right, retinal surface; middle, intermediate level; left, just below the lens). Arrowheads denote hyaloid vessels, arrow denotes retinal vessel. Scale bars: 1 mm (A, left); 100 μm (A, middle and right).
Figure 5
Figure 5. SrfiECKO retinal capillaries grow on a normal astrocytic network, are covered by collagen IV, and display elevated P-cofilin in distal microaneurysms.
(A) Retinal flat-mounts stained for ILB4 (green) and GFAP (red) of P6 control and SrfiECKO mice. (B) Retinal flat-mounts stained for ILB4 (green) and collagen IV (red) of P10 control and SrfiECKO mice. (C) Retinal flat-mounts stained for ILB4 (green) and P-cofilin (red) of P10 control and SrfiECKO mice. (D) 2 representative pairs of control and SrfiECKO whole–retinal tissue Western blots of P-cofilin. GAPDH served as loading control. (E) Western blot signals of P-cofilin from whole retinal tissue, expressed as percent of control. n = 8. Scale bar: 50 μm (AC). *P < 0.05 vs. respective control.
Figure 6
Figure 6. Retinal NV upon adult-induced SRF depletion.
NV lesions are indicated by red circles. (A) Left and middle: Fundus imaging (514 nm) of control and SrfiECKO adult animals. Right: OCT visualizing an intraretinal capillary targeting the RPE (white arrow). (B and C) ICG angiography (795 nm) to show retinal and choroidal vessels (B), and (C) FLA to enhance visibility of retinal vessels and capillaries, for control and SrfiECKO adult animals. Higher-magnification views of 2 local NV structures in SrfiECKO animals are shown at right (enlarged ×3-fold). (D) H&E staining on paraffin sections revealed normal layering in control eyes, but intraretinal NV structures in SrfiECKO eyes, penetrating toward the RPE. Red arrow indicates RPE cells surrounding the NV sprout. (E) Fluorescent imaging of control and SrfiECKO eyes on paraffin sections. EC staining with ILB4 (green) and cell nuclei (blue) in the subretinal space. White arrow indicates an ILB4-positive blood vessel. Scale bars: 50 μm (D and E).
Figure 7
Figure 7. NV causes non–uniformly distributed focal lesions in adult SRF-depleted retinae and results in retinal mislayering and photoreceptor degeneration.
(A) H&E staining on paraffin sections of SrfiECKO eyes showed retinal abnormalities, including NV lesion connecting to and rupturing the RPE (arrow), local displacement of ONL cells (double arrow), and mislayering of INL and ONL and thinning of the ONL (triple arrow), accompanied by local disruption of photoreceptors. (B) Semiquantitative RT-PCR analysis of Vegfa, Opn1, and Rho mRNA expression of whole retinal tissue of 6- to 8-month-old control and SrfiECKO animals. mRNA levels were normalized to Gapdh and expressed as percent of control. n = 6 per group. (C) Representative Western blot analysis of SRF levels in immortalized mECs transfected with control siRNA and siRNA against Srf for 2 or 3 days. GAPDH was used as a loading control. (D) Quantitation of Western blot analysis in C, normalized to GAPDH and expressed as percent of control siRNA. n = 5. (E) Semiquantitative RT-PCR analysis of Srf, Thbs1, Actb, and Cfl1 mRNA expression in immortalized mECs after transfection with siRNA against Srf compared with transfection with control siRNA. mRNA levels were normalized to Gapdh and expressed as percent of control. n = 5 experiments. (F) Quantitation of anti-SRF ChIP signals for promoter regions of Pak1 (CArG-box negative locus used as normalization control), Actb (positive reference), and Thbs1. n = 5. Scale bar: 50 μm (A). *P < 0.05, **P < 0.01, ***P < 0.001 vs. respective control.
Figure 8
Figure 8. The TCF-type SRF cofactors ELK1 and ELK4 are not essential for normal retinal angiogenesis.
(A) ILB4 staining on P6 control and Elk1–/–Elk4–/– retinae. Images are composites (see Methods). (B) Quantitation of retinal area covered by blood vessels (percent radial outgrowth) at P6. n = 39 retinae (control); 20 retinae (Elk1–/–Elk4–/–). (C) Representative images of angiogenic fronts at P6. (D) ILB4 staining on P10 retinae. Images are composites (see Methods). (E) Percent radial outgrowth at P10. n = 10 retinae per group. (F and G) ILB4-stained retinal capillaries of (F) the primary plexus and (G) deep plexi at P10. Scale bars: 1 mm (A and D); 30 μm (C); 50 μm (F and G).
Figure 9
Figure 9. MRTF-A and MRTF-B are essential for retinal angiogenesis.
(A) ILB4-staining on retinal flat-mounts of P6 control and Mrtfa–/–MrtfbiECKO mice. Top: Progression of angiogenic front. Red arrow indicates recessed angiogenic front of primary plexus. Images are composites (see Methods). Middle: Vessel density between artery (A) and vein (V). Bottom: Sprout morphology. White arrows indicate filopodia; red asterisks indicate abnormal morphologies of Mrtfa–/–MrtfbiECKO tip cells. (BD) Quantitation of (B) percent radial outgrowth; (C) relative branch points in field of view (boxed regions in A, middle); and (D) abnormal sprouts. n = 4 (control); 6 (Mrtfa–/–MrtfbiECKO). (E and F) Quantitation of (E) filopodia number per sprout and (F) filopodia mean length. n = 54 sprouts (control); 71 sprouts (Mrtfa–/–MrtfbiECKO). (G) ILB4-stained retinal flat-mounts of P10 control and Mrtfa–/–MrtfbiECKO retinae. Red arrow indicates recessed Mrtfa–/–MrtfbiECKO angiogenic front. Images are composites (see Methods). (H) Percent radial outgrowth. n = 9 (control); 5 (Mrtfa–/–MrtfbiECKO). (I and J) Higher-magnification views of (I) primary plexus and (J) deep plexi. (K) Percent radial outgrowth in P8 retinae, including all genotypes resulting from our mating scheme. n = 8 (Mrtfa+/–Mrtfbfl/x); 7 (Mrtfa–/–Mrtfbfl/x); 5 (Mrtfa+/–Mrtfbfl/WT-iECKO and Mrtfa+/–Mrtfbfl/fl-iECKO); 6 (Mrtfa–/–Mrtfbfl/WT-iECKO and Mrtfa–/–MrtfbiECKO). See Supplemental Figure 3 for statistical comparisons. Scale bars: 1 mm (A, top, and G); 50 μm (A, middle, and I and J); 10 μm (A, bottom). *P < 0.05, **P < 0.01, ***P < 0.001 vs. respective control.
Figure 10
Figure 10. VEGF-A activates nuclear translocation of MRTF-A.
(A) mECs were stimulated with serum, VEGF-A, or VEGF-A in the presence of latrunculin B (LatB) and stained for nuclei (DAPI; blue), MRTF-A (green), and F-actin (phalloidin; red). (B) Scheme of (TSm)2 and (Tmm)2 luciferase reporter constructs, which contain 2 tandem copies of the c-Fos SRE upstream of the thymidine kinase basal promoter sequence (tk120; –120 to +1), able to drive luciferase cDNA expression. (C) Relative luciferase activity in reporter-transfected HRMECs, with or without cotransfection of MRTF-A expression vectors and with or without VEGF-A stimulation. (D) Semiquantitative RT-PCR for genomic candidate mRNA expression in mECs upon VEGF-A treatment, expressed as percent untreated control. n = 4 (Flt1, Srf, and Actb); 3 (Kdr and Fos). (E) VEGF signaling leads to activation of the actin-MRTF-SRF axis. Note that interaction of MRTF and TCF cofactors (ELK1 and ELK4) with SRF is mutually exclusive. Scale bars: 10 μm (A). *P < 0.05, **P < 0.01 vs. respective control.

Similar articles

Cited by

References

    1. Adams RH, Alitalo K. Molecular regulation of angiogenesis and lymphangiogenesis. Nat Rev Mol Cell Biol. 2007;8(6):464–478. - PubMed
    1. Carmeliet P, Jain RK. Angiogenesis in cancer and other diseases. Nature. 2000;407(6801):249–257. doi: 10.1038/35025220. - DOI - PubMed
    1. Ye X, Wang Y, Nathans J. The Norrin/Frizzled4 signaling pathway in retinal vascular development and disease. Trends Mol Med. 2010;16(9):417–425. doi: 10.1016/j.molmed.2010.07.003. - DOI - PMC - PubMed
    1. Sapieha P, et al. Retinopathy of prematurity: understanding ischemic retinal vasculopathies at an extreme of life. J Clin Invest. 2010;120(9):3022–3032. doi: 10.1172/JCI42142. - DOI - PMC - PubMed
    1. Hammes HP, Feng Y, Pfister F, Brownlee M. Diabetic retinopathy: targeting vasoregression. Diabetes. 2011;60(1):9–16. doi: 10.2337/db10-0454. - DOI - PMC - PubMed

Publication types

MeSH terms