

Postnatal progression of bone disease in the cervical spines of mucopolysaccharidosis I dogs
- PMID: 23563357
- PMCID: PMC3668665
- DOI: 10.1016/j.bone.2013.03.014
Postnatal progression of bone disease in the cervical spines of mucopolysaccharidosis I dogs
Abstract
Introduction: Mucopolysaccharidosis I (MPS I) is a lysosomal storage disorder characterized by deficient α-l-iduronidase activity leading to accumulation of poorly degraded dermatan and heparan sulfate glycosaminoglycans (GAGs). MPS I is associated with significant cervical spine disease, including vertebral dysplasia, odontoid hypoplasia, and accelerated disk degeneration, leading to spinal cord compression and kypho-scoliosis. The objective of this study was to establish the nature and rate of progression of cervical vertebral bone disease in MPS I using a canine model.
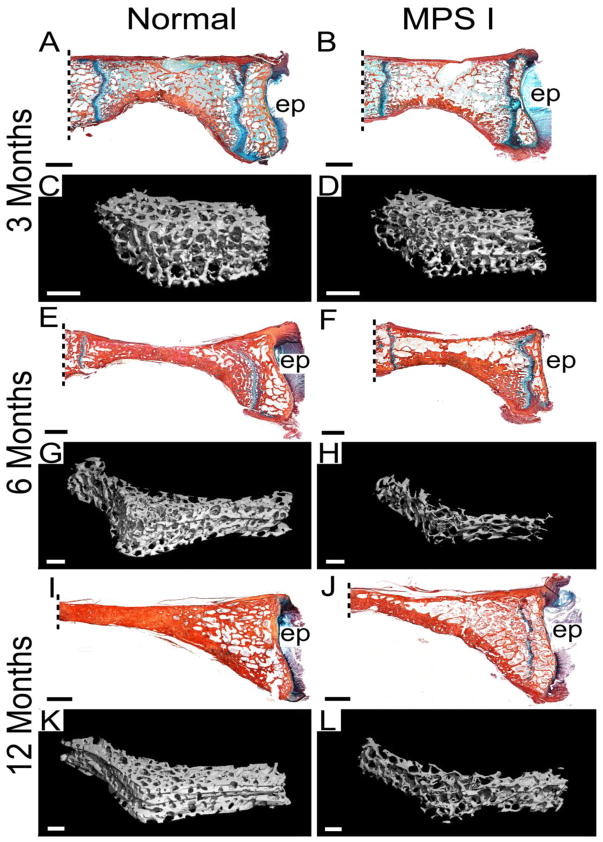
Methods: C2 vertebrae were obtained post-mortem from normal and MPS I dogs at 3, 6 and 12 months-of-age. Morphometric parameters and mineral density for the vertebral trabecular bone and odontoid process were determined using micro-computed tomography. Vertebrae were then processed for paraffin histology, and cartilage area in both the vertebral epiphyses and odontoid process were quantified.
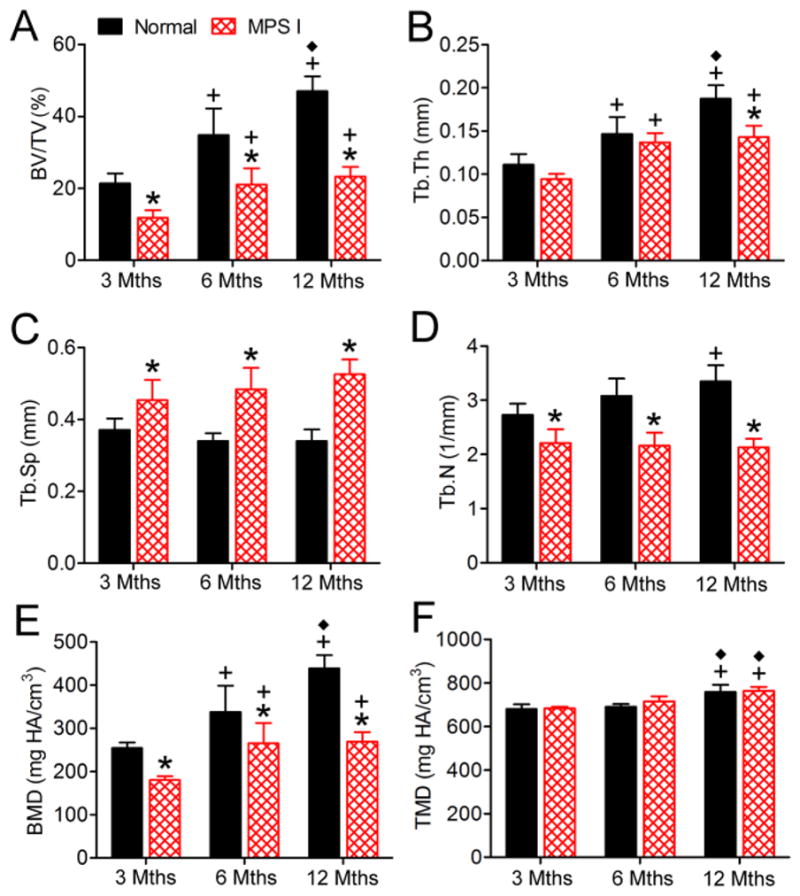
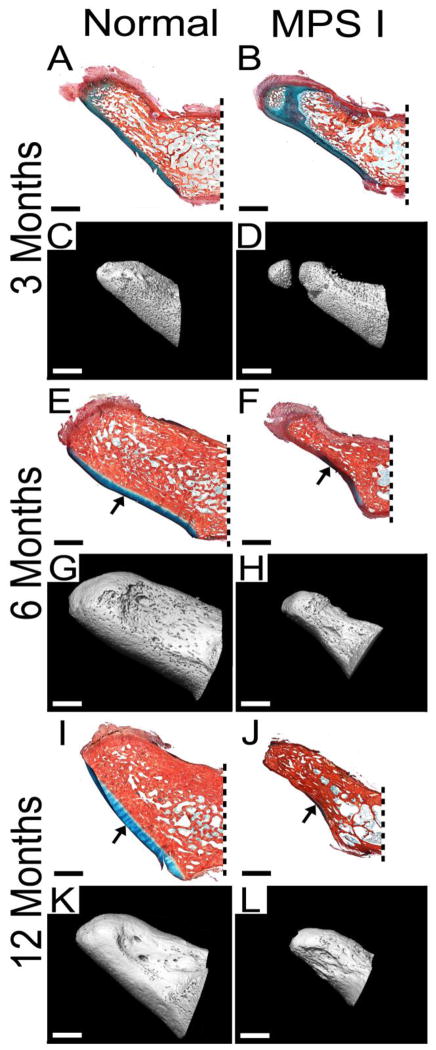
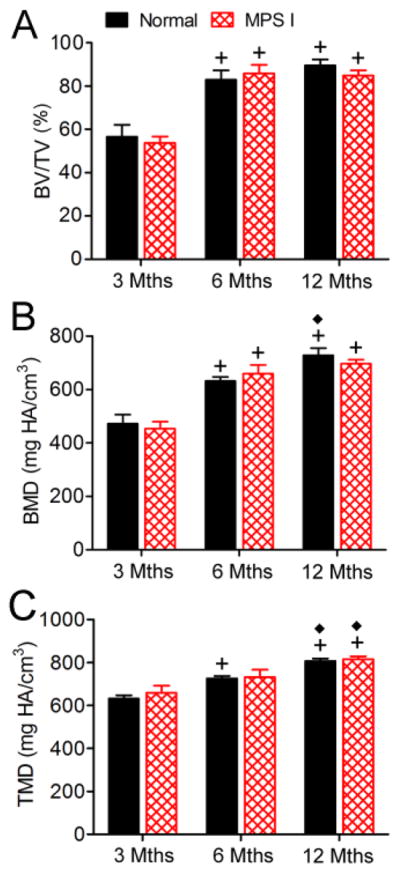
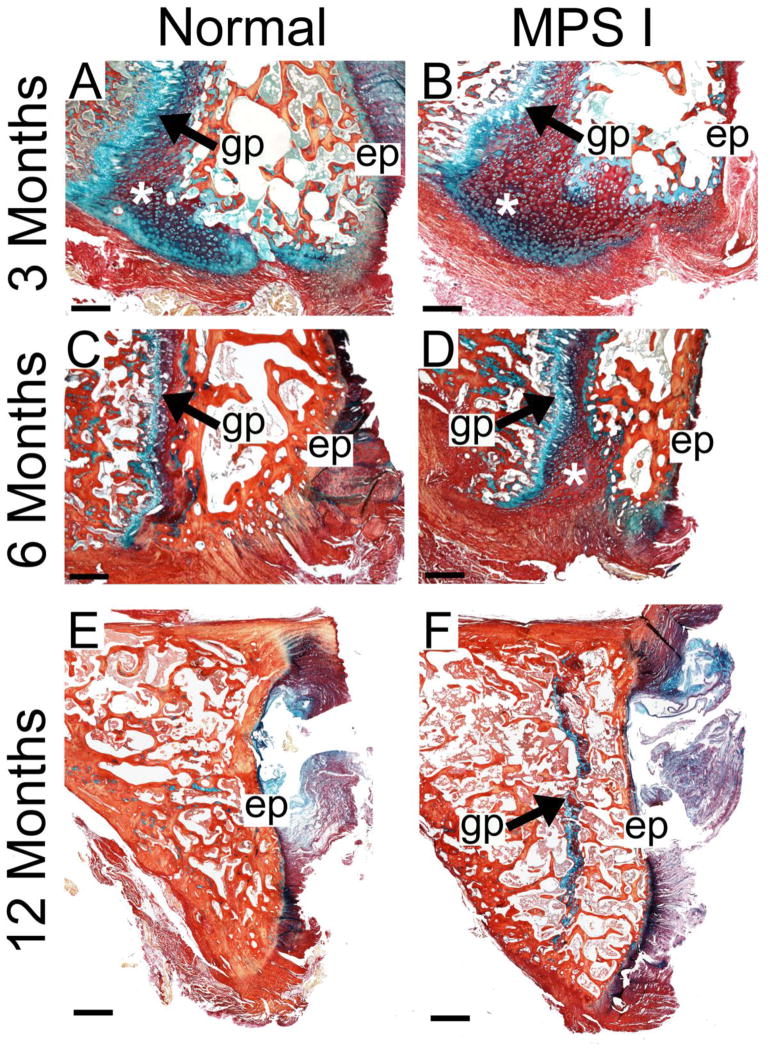
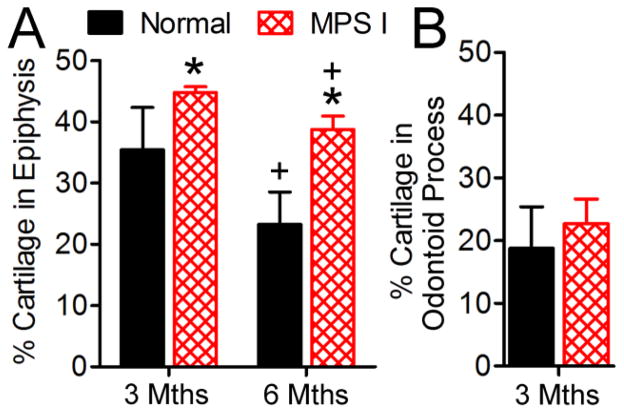
Results: Vertebral bodies of MPS I dogs had lower trabecular bone volume/total volume (BV/TV), trabecular thickness (Tb.Th), trabecular number (Tb.N) and bone mineral density (BMD) than normals at all ages. For MPS I dogs, BV/TV, Tb.Th and BMD plateaued after 6 months-of-age. The odontoid process appeared morphologically abnormal for MPS I dogs at 6 and 12 months-of-age, although BV/TV and BMD were not significantly different from normals. MPS I dogs had significantly more cartilage in the vertebral epiphyses at both 3 and 6 months-of-age. At 12 months-of-age, epiphyseal growth plates in normal dogs were absent, but in MPS I dogs they persisted.
Conclusions: In this study we report reduced trabecular bone content and mineralization, and delayed cartilage to bone conversion in MPS I dogs from 3 months-of-age, which may increase vertebral fracture risk and contribute to progressive deformity. The abnormalities of the odontoid process we describe likely contribute to increased incidence of atlanto-axial subluxation observed clinically. Therapeutic strategies that enhance bone formation may decrease incidence of spine disease in MPS I patients.
Copyright © 2013 Elsevier Inc. All rights reserved.
Figures
Similar articles
-
Effects of neonatal enzyme replacement therapy and simvastatin treatment on cervical spine disease in mucopolysaccharidosis I dogs.J Bone Miner Res. 2014 Dec;29(12):2610-7. doi: 10.1002/jbmr.2290. J Bone Miner Res. 2014. PMID: 24898323 Free PMC article.
-
Effects of lithium administration on vertebral bone disease in mucopolysaccharidosis I dogs.Bone. 2022 Jan;154:116237. doi: 10.1016/j.bone.2021.116237. Epub 2021 Oct 22. Bone. 2022. PMID: 34695616 Free PMC article.
-
Delayed hypertrophic differentiation of epiphyseal chondrocytes contributes to failed secondary ossification in mucopolysaccharidosis VII dogs.Mol Genet Metab. 2015 Nov;116(3):195-203. doi: 10.1016/j.ymgme.2015.09.008. Epub 2015 Sep 26. Mol Genet Metab. 2015. PMID: 26422116 Free PMC article.
-
Mucopolysaccharidosis type I.Pediatr Endocrinol Rev. 2014 Sep;12 Suppl 1:102-6. Pediatr Endocrinol Rev. 2014. PMID: 25345091 Review.
-
Enzyme replacement therapy in mucopolysaccharidosis type I: progress and emerging difficulties.J Inherit Metab Dis. 2001 Apr;24(2):245-50. doi: 10.1023/a:1010379320378. J Inherit Metab Dis. 2001. PMID: 11405343 Review.
Cited by
-
Mucopolysaccharidosis Type I: A Review of the Natural History and Molecular Pathology.Cells. 2020 Aug 5;9(8):1838. doi: 10.3390/cells9081838. Cells. 2020. PMID: 32764324 Free PMC article. Review.
-
Failures of Endochondral Ossification in the Mucopolysaccharidoses.Curr Osteoporos Rep. 2020 Dec;18(6):759-773. doi: 10.1007/s11914-020-00626-y. Epub 2020 Oct 16. Curr Osteoporos Rep. 2020. PMID: 33064251 Free PMC article. Review.
-
Ultrastructural analysis of different skeletal cell types in mucopolysaccharidosis dogs at the onset of postnatal growth.J Anat. 2021 Feb;238(2):416-425. doi: 10.1111/joa.13305. Epub 2020 Sep 7. J Anat. 2021. PMID: 32895948 Free PMC article.
-
Pentosan Polysulfate: Oral Versus Subcutaneous Injection in Mucopolysaccharidosis Type I Dogs.PLoS One. 2016 Apr 11;11(4):e0153136. doi: 10.1371/journal.pone.0153136. eCollection 2016. PLoS One. 2016. PMID: 27064989 Free PMC article.
-
Bone Biomarkers in Mucopolysaccharidoses.Int J Mol Sci. 2021 Nov 23;22(23):12651. doi: 10.3390/ijms222312651. Int J Mol Sci. 2021. PMID: 34884458 Free PMC article. Review.
References
-
- Neufeld EF, Muenzer J. The Mucopolysaccharidoses. In: Scriver CR, Beaudet AL, Sly WS, Valle D, editors. The metabolic and molecular bases of inherited disease. 8. New York: McGraw-Hill; 2001. pp. 3421–3452.
-
- Scott HS, Bunge S, Gal A, Clarke LA, Morris CP, Hopwood JJ. Molecular genetics of mucopolysaccharidosis type I: diagnostic, clinical, and biological implications. Hum Mutat. 1995;6:288–302. - PubMed
-
- Tandon V, Williamson JB, Cowie RA, Wraith JE. Spinal problems in mucopolysaccharidosis I (Hurler syndrome) J Bone Joint Surg Br. 1996;78:938–44. - PubMed
-
- Kachur E, Del Maestro R. Mucopolysaccharidoses and spinal cord compression: case report and review of the literature with implications of bone marrow transplantation. Neurosurgery. 2000;47:223–8. discussion 228–9. - PubMed
-
- Weisstein JS, Delgado E, Steinbach LS, Hart K, Packman S. Musculoskeletal manifestations of Hurler syndrome: long-term follow-up after bone marrow transplantation. J Pediatr Orthop. 2004;24:97–101. - PubMed
Publication types
MeSH terms
Grants and funding
LinkOut - more resources
Full Text Sources
Other Literature Sources
Medical
Miscellaneous
