

Advances in MALDI mass spectrometry in clinical diagnostic applications
- PMID: 23563502
- PMCID: PMC7121589
- DOI: 10.1007/128_2012_413
Advances in MALDI mass spectrometry in clinical diagnostic applications
Abstract
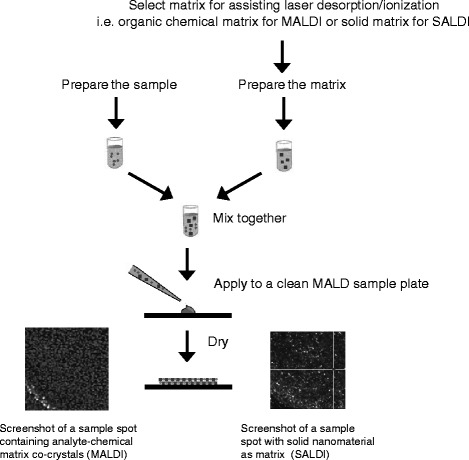
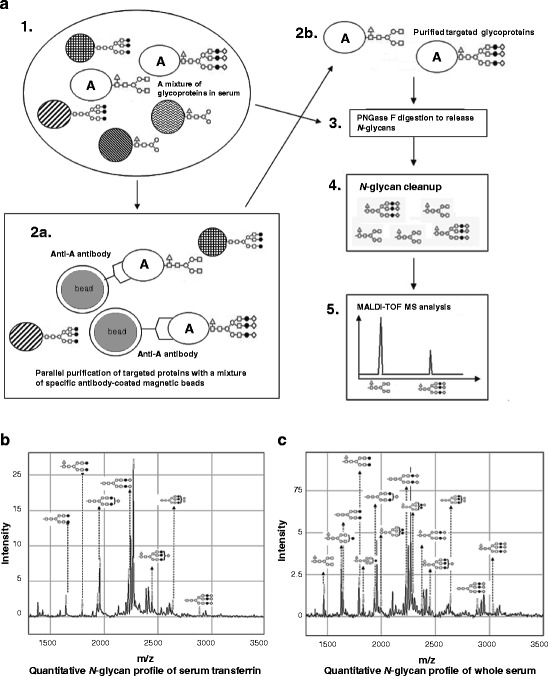
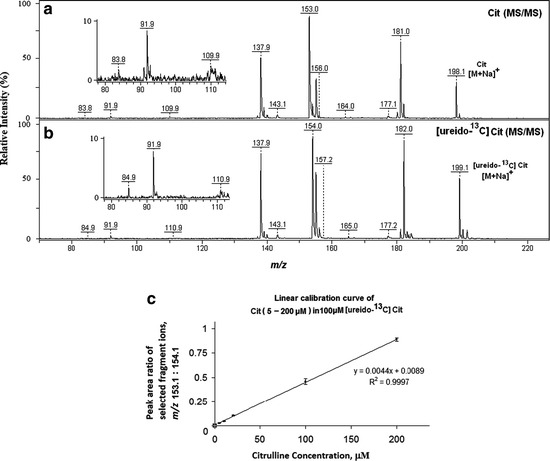
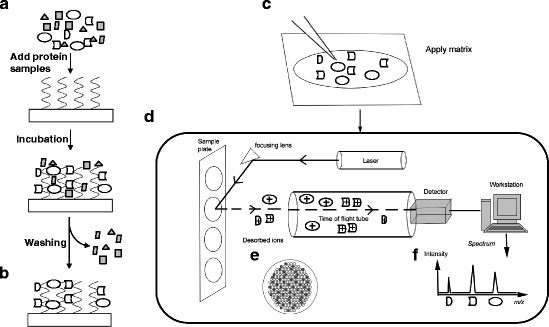
The concept of matrix-assisted laser desorption/ionization mass spectrometry (MALDI MS) was first reported in 1985. Since then, MALDI MS technologies have been evolving, and successfully used in genome, proteome, metabolome, and clinical diagnostic research. These technologies are high-throughput and sensitive. Emerging evidence has shown that they are not only useful in qualitative and quantitative analyses of proteins, but also of other types of biomolecules, such as DNA, glycans, and metabolites. Recently, parallel fragmentation monitoring (PFM), which is a method comparable to selected reaction monitoring, has been reported. This highlights the potentials of MALDI-TOF/TOF tandem MS in quantification of metabolites. Here we critically review the applications of the major MALDI MS technologies, including MALDI-TOF MS, MALDI-TOF/TOF MS, SALDI-TOF MS, MALDI-QqQ MS, and SELDI-TOF MS, to the discovery and quantification of disease biomarkers in biological specimens, especially those in plasma/serum specimens. Using SELDI-TOF MS as an example, the presence of systemic bias in biomarker discovery studies employing MALDI-TOF MS and its possible solutions are also discussed in this chapter. The concepts of MALDI, SALDI, SELDI, and PFM are complementary to each other. Theoretically, all these technologies can be combined, leading to the next generation of the MALDI MS technologies. Real applications of MALDI MS technologies in clinical diagnostics should be forthcoming.
Figures
Similar articles
-
Comparison of biomarker based Matrix Assisted Laser Desorption Ionization-Time of Flight Mass Spectrometry (MALDI-TOF MS) and conventional methods in the identification of clinically relevant bacteria and yeast.BMC Microbiol. 2017 May 25;17(1):128. doi: 10.1186/s12866-017-1037-z. BMC Microbiol. 2017. PMID: 28545528 Free PMC article.
-
The MALDI-TOF mass spectrometric view of the plasma proteome and peptidome.Clin Chem. 2006 Jul;52(7):1223-37. doi: 10.1373/clinchem.2006.069252. Epub 2006 Apr 27. Clin Chem. 2006. PMID: 16644871 Review.
-
Current Status of Matrix-Assisted Laser Desorption/Ionization-Time-of-Flight Mass Spectrometry (MALDI-TOF MS) in Clinical Diagnostic Microbiology.Molecules. 2020 Oct 17;25(20):4775. doi: 10.3390/molecules25204775. Molecules. 2020. PMID: 33080897 Free PMC article. Review.
-
Detection and identification of a protein biomarker in antibiotic-resistant Escherichia coli using intact protein LC offline MALDI-MS and MS/MS.J Appl Microbiol. 2020 Mar;128(3):697-709. doi: 10.1111/jam.14507. Epub 2019 Dec 9. J Appl Microbiol. 2020. PMID: 31715076 Free PMC article.
-
High-throughput identification of bacteria and yeast by matrix-assisted laser desorption ionization-time of flight mass spectrometry in conventional medical microbiology laboratories.J Clin Microbiol. 2010 Mar;48(3):900-7. doi: 10.1128/JCM.02071-09. Epub 2010 Jan 6. J Clin Microbiol. 2010. PMID: 20053859 Free PMC article.
Cited by
-
MALDI-TOF Mass Spectrometry in Clinical Analysis and Research.ACS Meas Sci Au. 2022 Jul 27;2(5):385-404. doi: 10.1021/acsmeasuresciau.2c00019. eCollection 2022 Oct 19. ACS Meas Sci Au. 2022. PMID: 36785658 Free PMC article. Review.
-
Automated affinity selection for rapid discovery of peptide binders.Chem Sci. 2021 Jul 14;12(32):10817-10824. doi: 10.1039/d1sc02587b. eCollection 2021 Aug 18. Chem Sci. 2021. PMID: 34447564 Free PMC article.
-
Comparative evaluation of 5-15-kDa salivary proteins from patients with different oral diseases by MALDI-TOF/TOF mass spectrometry.Clin Oral Investig. 2015 Apr;19(3):729-37. doi: 10.1007/s00784-014-1293-3. Epub 2014 Aug 1. Clin Oral Investig. 2015. PMID: 25078551
-
Scutellaria barbata polysaccharides inhibit tumor growth and affect the serum proteomic profiling of hepatoma H22‑bearing mice.Mol Med Rep. 2019 Mar;19(3):2254-2262. doi: 10.3892/mmr.2019.9862. Epub 2019 Jan 15. Mol Med Rep. 2019. PMID: 30664217 Free PMC article.
-
Molecular phenotyping approaches for the detection and monitoring of carbapenem-resistant Enterobacteriaceae by mass spectrometry.J Mass Spectrom Adv Clin Lab. 2022 Sep 6;26:9-19. doi: 10.1016/j.jmsacl.2022.09.001. eCollection 2022 Nov. J Mass Spectrom Adv Clin Lab. 2022. PMID: 36105942 Free PMC article. Review.
References
-
- Karas M, Bachmann D, Hillenkamp F. Influence of the wavelength in high-irradiance ultraviolet laser desorption mass spectrometry of organic molecules. Anal Chem. 1985;57:2935–2939. doi: 10.1021/ac00291a042. - DOI
-
- Tanaka K, Waki H, Ido Y, Akita S, Yoshida Y, Yoshida T. Protein and polymer analyses up to m/z 100 000 by laser ionization time-of-flight mass spectrometry. Rapid Commun Mass Spectrom. 1988;2:151–153. doi: 10.1002/rcm.1290020802. - DOI
-
- Pang RTK, Johnson PJ, Chan CML, Kong EKC, Chan ATC, Sung JJY, Poon TCW. Technical evaluation of MALDI-TOF mass spectrometry for quantitative proteomic profiling – matrix formulation and application. Clin Proteomics. 2004;1:259–270. doi: 10.1385/CP:1:3-4:259. - DOI
Publication types
MeSH terms
Substances
LinkOut - more resources
Full Text Sources
Other Literature Sources
Medical
