. 2013 May;16(5):605-12.
doi: 10.1038/nn.3373. Epub 2013 Apr 7.

Noradrenaline is a stress-associated metaplastic signal at GABA synapses

Affiliations

Noradrenaline is a stress-associated metaplastic signal at GABA synapses

Wataru Inoue et al. Nat Neurosci. 2013 May.

Abstract

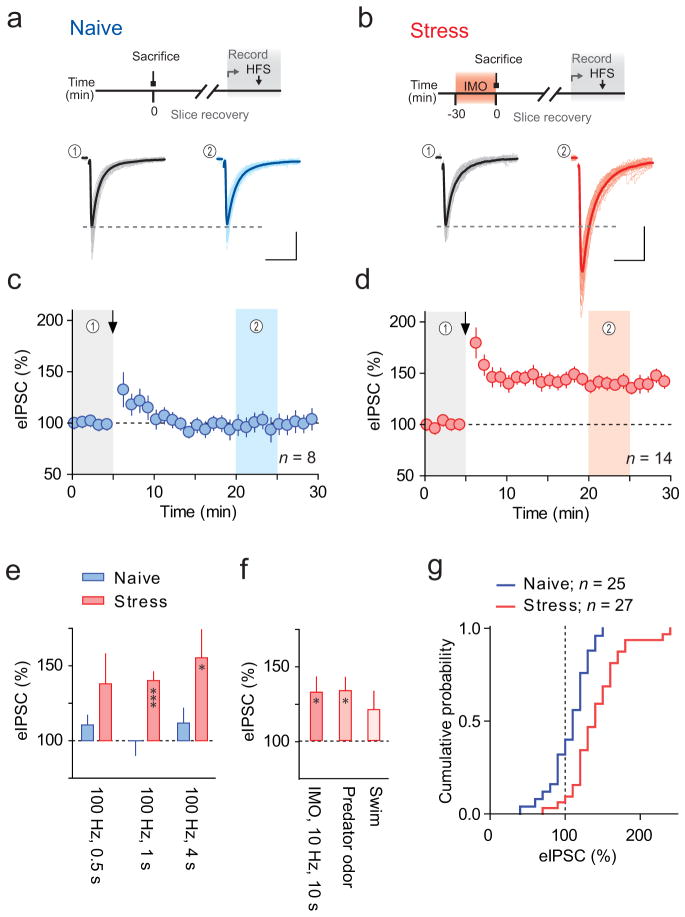
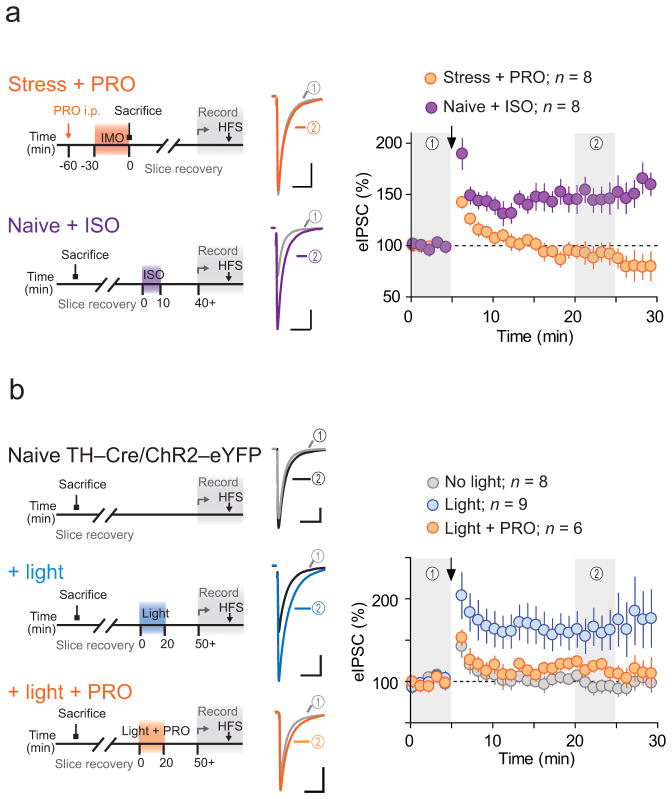
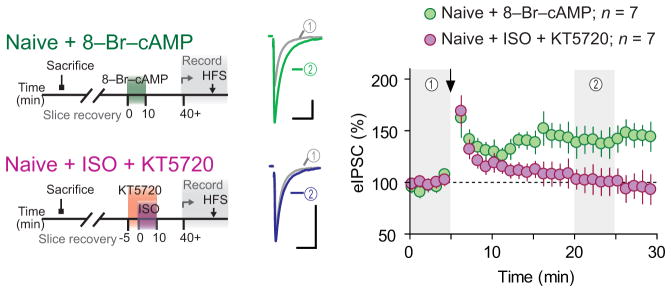
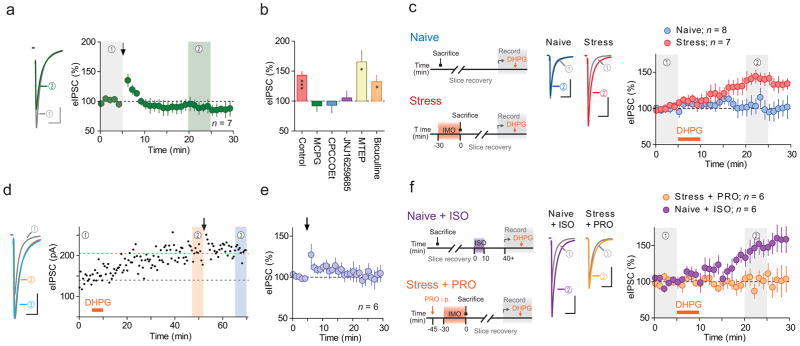
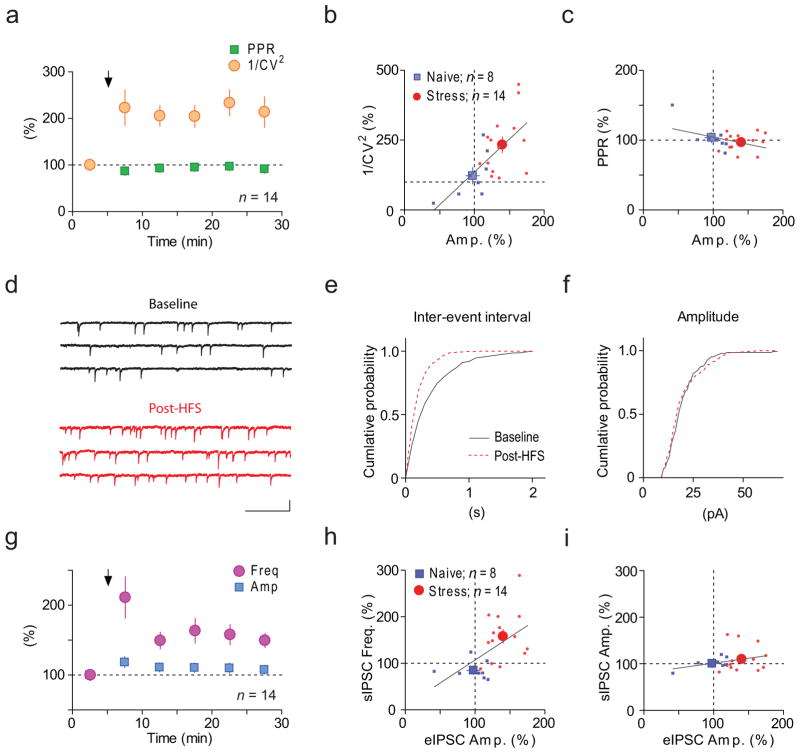
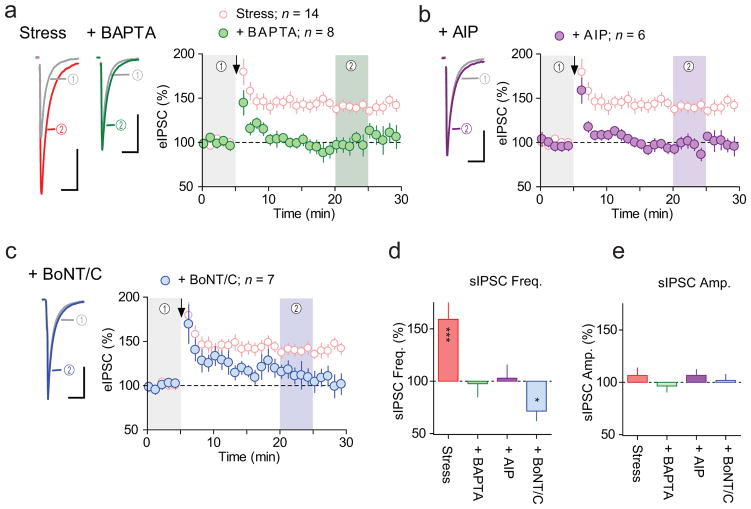
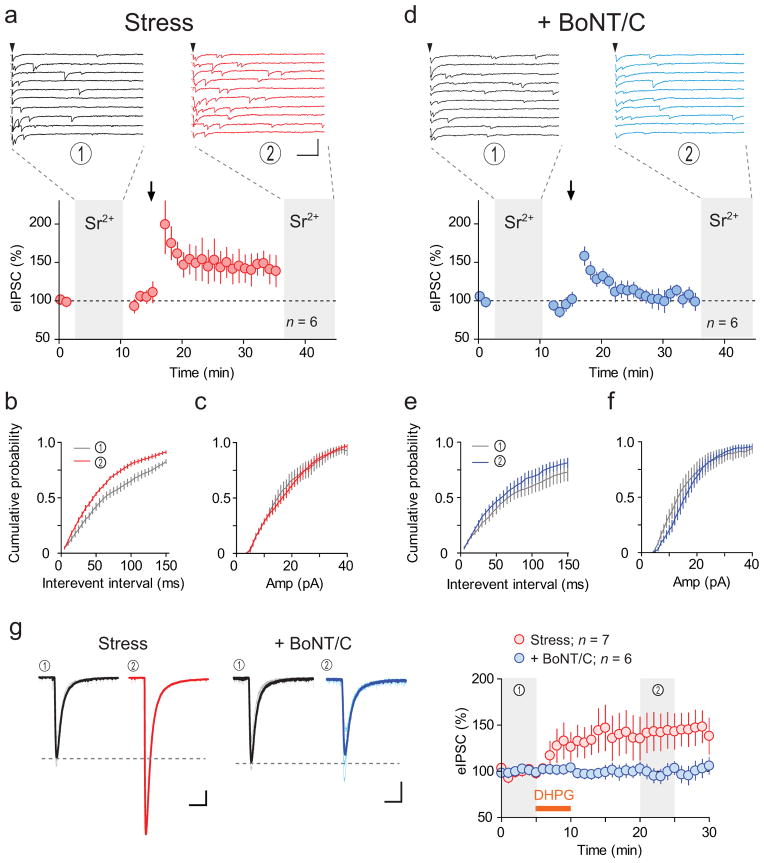
Exposure to a stressor sensitizes behavioral and hormonal responses to future stressors. Stress-associated release of noradrenaline enhances the capacity of central synapses to show plasticity (metaplasticity). We found noradrenaline-dependent metaplasticity at GABA synapses in the paraventricular nucleus of the hypothalamus in rat and mouse that controls the hypothalamic-pituitary-adrenal axis. In vivo stress exposure was required for these synapses to undergo activity-dependent long-term potentiation (LTPGABA). The activation of β-adrenergic receptors during stress functionally upregulated metabotropic glutamate receptor 1 (mGluR1), allowing for mGluR1-dependent LTPGABA during afferent bursts. LTPGABA was expressed postsynaptically and manifested as the emergence of new functional synapses. Our findings provide, to the best of our knowledge, the first demonstration that noradrenaline release during an in vivo challenge alters information storage capacity at GABA synapses. Because these GABA synapses become excitatory following acute stress, this metaplasticity may contribute to neuroendocrine sensitization to stress.


Figures

Figure 1
Figure 1. Acute stress unmasks activity-dependent LTPGABA
(a, b) Top, schematics for experiments, Bottom, raw (light) and averaged (solid) traces of eIPSCs recorded from PNCs before (black) and after (blue/red) HFS in slices from (a) naïve and (b) IMO stressed rats. Scale bars represent 50 pA and 20 ms. Amplitude values were assessed at the time points indicated by shadowed bands below. (c, d) Summary time-course of eIPSC amplitude recorded in slices from naïve (blue, (n = 8 (7 rats)) and IMO stressed (red, (n = 14 (14 rats)) rats. Arrows indicate time of HFS. Data are mean ± s.e.m. (e) Summary of the changes of eIPSC amplitude, in slices from naïve and IMO stressed rats following different durations of HFS (0.5, 1, 4 s; n=7, 10, 6 (5 rats each)). (f) Summary of eIPSC amplitude change in slices from IMO stressed rats following lower frequency stimulation (10 Hz for 10 s, n=5 (5 rats)), and in slices from rats exposed to predator odor (n=5 (5 rats) or forced swim (n=7 (5 rats) following HFS. (g) Cumulative probability distribution of normalized eIPSC amplitude from naïve (blue) and IMO-stressed (red) rats following HFS shown in (e). Bin size 10 %.
Figure 2
Figure 2. Stress-induced β-AR signaling unmasks activity-dependent LTPGABA
Left, schematics for the experiments. Middle, averaged traces before (grey) and after (colored) HFS. Right, summary time-course of normalized eIPSCs. (a) Recordings in slices from IMO rats treated with β-AR antagonist PRO (purple, n = 8 (6 rats)) and in slices from naïve rats treated ex vivo with β-AR agonist ISO (orange, n = 8 (6 rats)) (b) Recordings in slices from naïve TH-Cre/ChR2-eYFP mice without treatment (gray, n = 8 (7 mice)), ex vivo flushed with blue light in the absence (blue, n = 9 (8 mice)) and presence (orange, n = 6 (4 mice)) of PRO. Scale bars represent 50 pA and 20 ms. Data are mean ± s.e.m.
Figure 3
Figure 3. β-AR-induced priming requires PKA activation
Recordings in slices from naïve rats treated ex vivo with PKA activator 8-Br-cAMP (green, n = 7 (4 rats)) and with ISO in the presence of PKA inhibitor KT5720 (purple, n = 7 (3 rats)). Scale bars represent 50 pA and 20 ms. Data are mean ± s.e.m.
Figure 4
Figure 4. LTPGABA requires priming of mGluR1 by β-AR activation
(a) Left, averaged traces before (grey) and after (green) HFS recorded in slices from IMO stressed rats, with bath application of MCPG (mGluR1/5 antagonist). Right, summary time-course. Arrow indicates HFS. (b) Summary of HFS-induced eIPSC amplitude changes in control (without antagonist, adapted from experiment shown in Fig. 1d) adapted from experiment shown in Fig. 1d, and with MCPG, n = 6 (4 rats), CPCCOEt (mGluR1 antagonist, n = 7 (5 rats)), JNJ16259685 (mGluR1 antagonist, n = 7 (5 rats)), MTEP (mGluR5 antagonist, n = 5 (4 rats)) and bicuculline (GABAAR antagonist, n = 5 (3rats)). * p < 0.03, *** p = 0.0001. (c) Left, schematics for the experiments. Middle, averaged traces of eIPSC before (grey) and after DHPG (mGluR1/5 agonist, blue/red) recorded in slices from naïve (blue, n = 8 (5 rats)) and IMO (red, n = 7 (5 rats)) rats. Right, summary time-course. (d) Left, averaged traces of eIPSC from time periods 1–3 indicated in the right graph. Right, time course of eIPSC amplitude recorded in a slice from IMO stressed rat. DHPG (orange bar) application was followed by HFS (arrow). Broken lines indicate the average amplitude before DHPG (black) and HFS (orange). (e) Summary of the effects of HFS on eIPSC amplitude after DHPG-induced potentiation, n = 6 (5 rats). (f) Left, schematics for the experiments. Middle, averaged traces of eIPSC before (grey) and after DHPG (orange/purple) recorded in slices from IMO rats injected with PRO (orange, n = 6 (6 rats)) and in slices from naïve rats treated ex vivo with ISO (purple, n = 9 (7 rats)). Right, summary time-course. Arrow and orange horizontal bars represent the time of HFS and DHPG application, respectively. Data are mean ± s.e.m. Scale bars represent 50 pA and 20 ms.
Figure 5
Figure 5. LTPGABA is accompanied by changes relevant to an increase of synapse number
(a) Summary time-course of normalized PPR (green) and 1/CV2 (orange) of eIPSCs recorded in slices from IMO stressed rats. Arrow indicates the time of HFS. (b, c) Plots of normalized post-HFS 1/CV2 (b) and PPR (c) against amplitude, recorded in slices from naïve (blue, n=16) and IMO stressed (red, n=21) rats. Smaller symbols represent individual data and larger ones mean ± s.e.m. Lines represent least square linear best fit. (d–f) Sample traces (d) and cumulative probability plots of sIPSC frequency (e) and amplitude (f) before (grey) and after (red) HFS recorded in a slice from IMO rats. Scale bars represent 20 pA and 500 ms. (g) Summary time-course of normalized sIPSC frequency (purple) and amplitude (blue) recorded in IMO slices. (h, i) Plots of normalized post-HFS sIPSC frequency (h) and sIPSC amplitude (i) against eIPSC amplitude recorded in slices from naïve (blue) and IMO stressed (red) rats.
Figure 6
Figure 6. LTPGABA requires postsynaptic mechanisms
(a–c) Left, average sample traces of eIPSC before (grey) and after (colored) HFS recorded in slices from IMO stressed rats where BAPTA (green, n = 9 (7 rats)), AIP (purple, n = 6 (3 rats)), or BoNT/C (blue, n = 6 (6 rats)) was included in the patch pipette. Without inhibitor group (pink, adopted from experiment shown in Fig. 1d) is shown for comparison. Right, summary time-course of normalized eIPSC amplitude. Arrows indicate the time of HFS. Scale bars represent 50 pA and 20 ms. (d–e) Summary of the effects of HFS on sIPSC frequency (d) and amplitude (e) where BAPTA, AIP or BoNT/C were included in the pitch pipette. Data represent mean ± s.e.m. * p = 0.02, *** p = 0.002.
Figure 7
Figure 7. Increase of active synapse number during LTPGABA requires postsynaptic mechanism
(a, d) Top, sample traces of asynchronous eIPSC in Sr2+ aCSF before (black) and after (red/blue) LTPGABA from the same neuron recorded in a slice from IMO-stressed rat. Scale bars represent 50 pA and 20 ms. Arrowheads indicate the time of afferent stimulation. Bottom, summary time course of eIPSC, n = 6 (4 rats). Ca2+ was replaced with equimolar Sr2+ during the time window indicated by shadows. Cumulative histograms of interevent interval (b, e) and amplitude (c, f) of the Sr2+-induced asynchronous eIPSCs before (grey) and after LTPGABA (red/blue). Experiments were conducted in the absence (a–c) and presence (d–f) of BoNT/C in the patch pipette, n = 6 (4 rats). (g) Left, raw (thin) and averaged (thick) traces of whole-cell current observed in response to focal pressure application of GABAAR agonist muscimol in slices from IMO-stressed rat. Traces are from the time windows indicated by shadows before (black) and after (red/blue) DHPG treatment. Right, summary time course of normalized muscimol-induced whole-cell current in the presence (blue, n = 6 (4 rats)), or absence n = 7 (5 rats), of BoNT/C in the patch pipette or not (red). Scale bars represent 100 pA and 1 s. Data are mean ± s.e.m.

References

    1. Joëls M, Baram TZ. The neuro-symphony of stress. Nat Rev Neurosci. 2009;10:459–466. - PMC - PubMed
    1. Ulrich-Lai YM, Herman JP. Neural regulation of endocrine and autonomic stress responses. Nat Rev Neurosci. 2009;10:397–409. - PMC - PubMed
    1. Cullinan WE, Ziegler DR, Herman JP. Functional role of local GABAergic influences on the HPA axis. Brain Struct Funct. 2008;213:63–72. - PubMed
    1. Armario A, Vallès A, Dal-Zotto S, Márquez C, Belda X. A single exposure to severe stressors causes long-term desensitisation of the physiological response to the homotypic stressor. Stress. 2004;7:157–172. - PubMed
    1. Flak JN, Ostrander MM, Tasker JG, Herman JP. Chronic stress-induced neurotransmitter plasticity in the PVN. J Comp Neurol. 2009;517:156–165. - PMC - PubMed

Publication types

MeSH terms

Grants and funding