

Performance of an automated polysomnography scoring system versus computer-assisted manual scoring
- PMID: 23565003
- PMCID: PMC3612255
- DOI: 10.5665/sleep.2548
Performance of an automated polysomnography scoring system versus computer-assisted manual scoring
Abstract
Study objectives: Manual scoring of polysomnograms (PSG) is labor intensive and has considerable variance between scorers. Automation of scoring could reduce cost and improve reproducibility. The purpose of this study was to compare a new automated scoring system (YST-Limited, Winnipeg, Canada) with computer-assisted manual scoring.
Design: Technical assessment.
Setting: Five academic medical centers.
Participants: N/A.
Interventions: N/A.
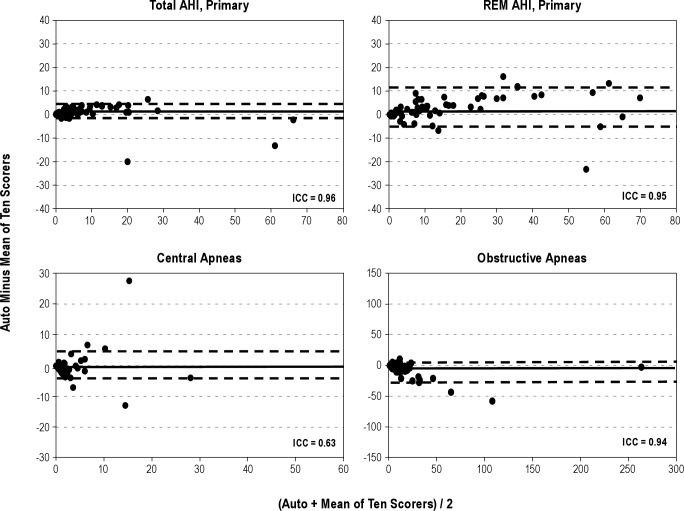
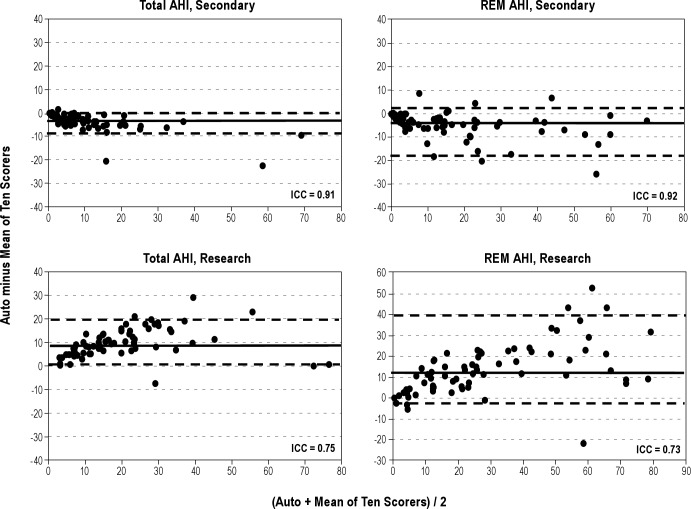
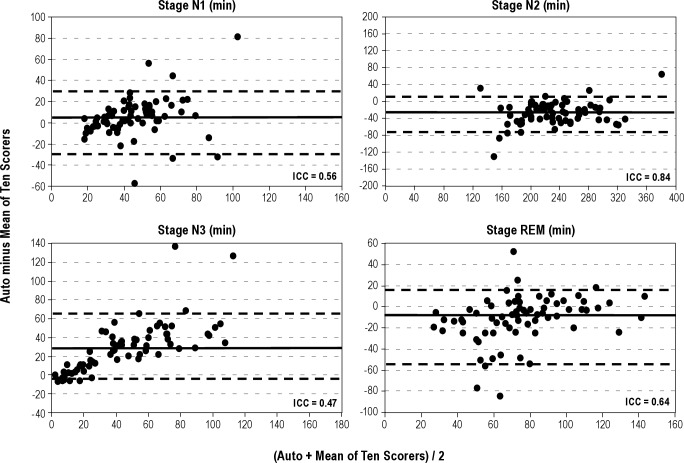
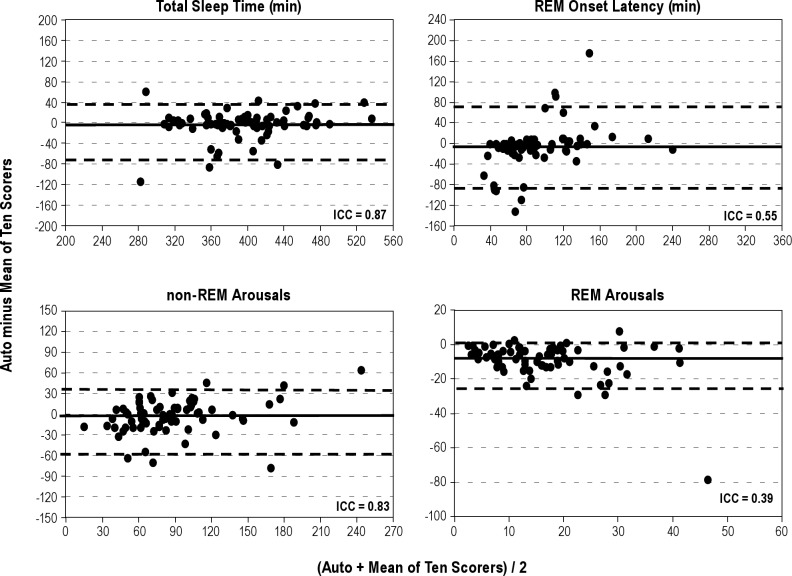
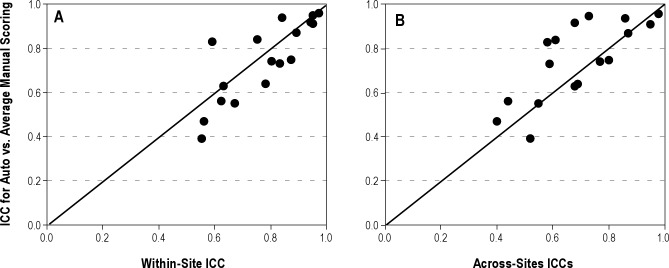
Measurements and results: Seventy PSG files were selected at University of Pennsylvania (Penn) and distributed to five US academic sleep centers. Two blinded technologists from each center scored each file. Automatic scoring was performed at Penn by a YST Limited technician using a laptop containing the software. Variables examined were sleep stages, arousals, and apnea-hypopnea index (AHI) using three methods of identifying hypopneas. Automatic scores were not edited and were compared to the average scores of the 10 technologists. Intraclass correlation coefficient (ICC) was obtained for the 70 pairs and compared to across-sites ICCs for manually scored results. ICCs for automatic versus manual scoring were > 0.8 for total sleep time, stage N2, and nonrapid eye movement arousals and > 0.9 for AHI scored by primary and secondary American Academy of Sleep Medicine criteria. ICCs for other variables were not as high but were comparable to the across-site ICCs for manually scored results.
Conclusion: The automatic system yielded results that were similar to those obtained by experienced technologists. Very good ICCs were obtained for many primary PSG outcome measures. This automated scoring software, particularly if supplemented with manual editing, may increase laboratory efficiency and standardize PSG scoring results within and across sleep centers.
Keywords: apnea-hypopnea index; lung; polysomnography; reliability; scoring; sleep.
Figures
Comment in
-
Entering the era of "big data": getting our metrics right.Sleep. 2013 Apr 1;36(4):465-9. doi: 10.5665/sleep.2524. Sleep. 2013. PMID: 23564993 Free PMC article. No abstract available.
References
-
- Young T, Palta M, Dempsey J, Skatrud J, Weber S, Badr S. The occur-rence of sleep-disordered breathing among middle-aged adults. N Engl J Med. 1993;328:1230–5. - PubMed
-
- Flegal KM, Carroll MD, Ogden CL, Curtin LR. Prevalence and trends in obesity among US adults, 1999-2008. JAMA. 2010;303:235–41. - PubMed
-
- Hosselet JJ, Norman RG, Ayappa I, Rapoport DM. Detection of flow limitation with a nasal cannula/pressure transducer system. Am J Respir Crit Care Med. 1998;157:1461–7. - PubMed
-
- Mulgrew AT, Fox N, Ayas NT, Ryan CF. Diagnosis and initial management of obstructive sleep apnea without polysomnography: a randomized validation study. Ann Intern Med. 2007;146:157–66. - PubMed
-
- Collop NA. Scoring variability between polysomnography technologists in different sleep laboratories. Sleep Med. 2002;3:43–7. - PubMed
Publication types
MeSH terms
Grants and funding
LinkOut - more resources
Full Text Sources
Other Literature Sources
Medical
