

Seasonal changes in the structure of rhesus macaque social networks
- PMID: 23565026
- PMCID: PMC3613995
- DOI: 10.1007/s00265-012-1455-8
Seasonal changes in the structure of rhesus macaque social networks
Abstract
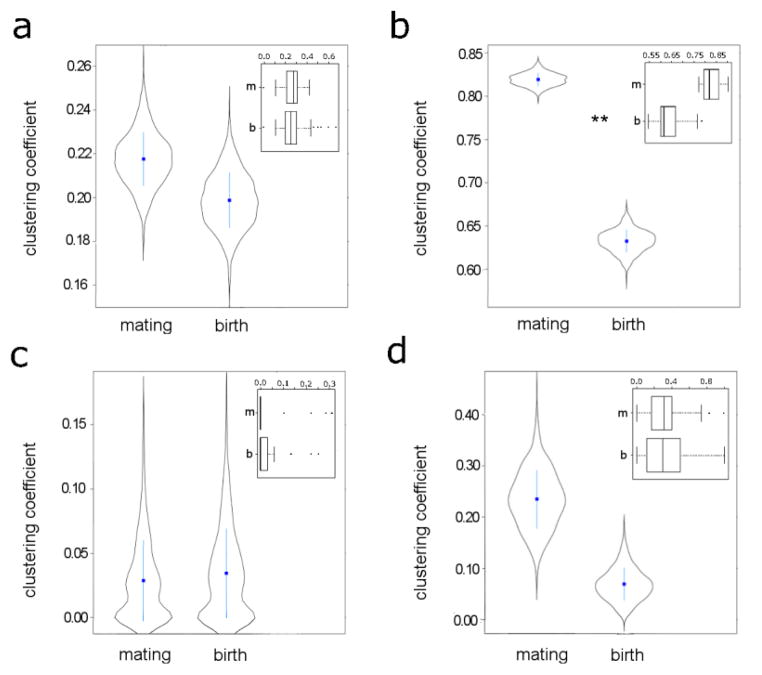
Social structure emerges from the patterning of interactions between individuals and plays a critical role in shaping some of the main characteristics of animal populations. The topological features of social structure, such as the extent to which individuals interact in clusters, can influence many biologically important factors, including the persistence of cooperation, and the rate of spread of disease. Yet the extent to which social structure topology fluctuates over relatively short periods of time in relation to social, demographic or environmental events remains unclear. Here, we use social network analysis to examine seasonal changes in the topology of social structures that emerge from socio-positive associations in adult female rhesus macaques (Macaca mulatta). Behavioral data for two different association types (grooming, spatial proximity) were collected for females in two free-ranging groups during two seasons: the mating and birth seasons. Stronger dyadic bonds resulted in social structures that were more tightly connected (i.e. of greater density) in the mating season compared to the birth season. Social structures were also more centralized around a subset of individuals, and were more clustered in the mating season than the birth season, although the latter differences were mostly driven by differences in density alone. Our results suggest a degree of temporal variation in the topological features of social structure in this population. Such variation may feed back on interactions, hence affecting the behaviors of individuals, and may therefore be important to take into account in studies of animal behavior.
Keywords: network topology; rhesus macaques; social network analysis; social structure.
Figures


References
-
- Altmann J. Observational study of behavior: Sampling methods. Behaviour. 1974;49:227–267. - PubMed
-
- Barrett L, Henzi PS. Constraints on relationship formation among female primates. Behaviour. 2002;139:263–289.
-
- Barrett L, Henzi PS, Weingrill T, Lycett JE, Hill RA. Market forces predict grooming reciprocity in female baboons. Proc R Soc Lond B. 1999;266:665–670.
-
- Borgatti SP, Everett MG, Freeman LC. UCINET for Windows: Software for Social Network Analysis. Analytic Technologies; Harvard, Massachusetts: 2002.
Grants and funding
LinkOut - more resources
Full Text Sources