. 2013;11(4):e1001528.
doi: 10.1371/journal.pbio.1001528. Epub 2013 Apr 2.

Promoter sequence determines the relationship between expression level and noise

Affiliations

Promoter sequence determines the relationship between expression level and noise

Lucas B Carey et al. PLoS Biol. 2013.

Abstract

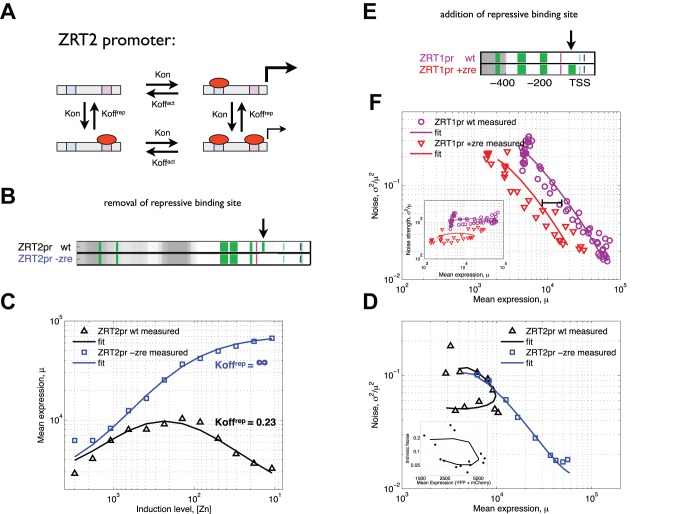
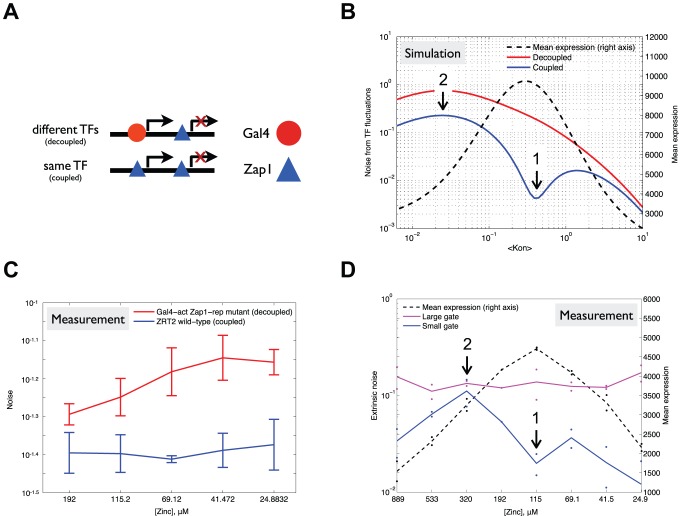
The ability of cells to accurately control gene expression levels in response to extracellular cues is limited by the inherently stochastic nature of transcriptional regulation. A change in transcription factor (TF) activity results in changes in the expression of its targets, but the way in which cell-to-cell variability in expression (noise) changes as a function of TF activity, and whether targets of the same TF behave similarly, is not known. Here, we measure expression and noise as a function of TF activity for 16 native targets of the transcription factor Zap1 that are regulated by it through diverse mechanisms. For most activated and repressed Zap1 targets, noise decreases as expression increases. Kinetic modeling suggests that this is due to two distinct Zap1-mediated mechanisms that both change the frequency of transcriptional bursts. Notably, we found that another mechanism of repression by Zap1, which is encoded in the promoter DNA, likely decreases the size of transcriptional bursts, producing a unique transcriptional state characterized by low expression and low noise. In addition, we find that further reduction in noise is achieved when a single TF both activates and represses a single target gene. Our results suggest a global principle whereby at low TF concentrations, the dominant source of differences in expression between promoters stems from differences in burst frequency, whereas at high TF concentrations differences in burst size dominate. Taken together, we show that the precise amount by which noise changes with expression is specific to the regulatory mechanism of transcription and translation that acts at each gene.


Conflict of interest statement

The authors have declared that no competing interests exist.

Figures

Figure 1
Figure 1. Measuring mean promoter activity and cell-to-cell variability for a library of Zap1 target promoters.
(A) The transcription factor Zap1 is induced by decreasing the concentration of zinc in the growth medium. A schematic of the site of chromosomal integration for measuring promoter-driven expression is shown. Each yeast strain has a single promoter inserted upstream of the YFP coding sequence. At the same locus a constitutively expressed mCherry is also integrated, which is used to normalize the YFP signal and correct for extrinsic cell-to-cell variability. (B) For each Zap1 target promoter the predicted locations of the major architectural features are shown. Promoters are aligned by the transcription start site (TSS) (cyan). PSSMs for the TATA box (purple) and Zap1 (green) were used to predict binding sites for TBP and Zap1, respectively. The width of the green bars is proportional to the predicted affinity of each Zap1 binding site. Darker shades of grey show regions with higher predicted nucleosome occupancy. Blue lines show translation start sites. (C) Zap1 activates its own transcription, in addition to other target promoters, such as Zrt1. Shown is the measured expression (the ratio between YFP and mCherry fluorescence) of the ZAP1 promoter and the activated target ZRT1, graphed against the concentration of zinc added to the growth media. The inset shows the single-cell distribution of measured fluorescence intensities for ZAP1 and ZRT1 at two zinc levels obtained from flow-cytometry. (D) Measured promoter-driven expression (quantified as the ratio between YFP and mCherry fluorescence) throughout the Zap1 induction is shown for each measured promoter. Each point shows the average of at least four biological replicates. (E and F) Noise and noise strength graphed against mean expression for each promoter that changes expression by more than 2-fold. The line η2 = cμk was fit (solid lines) to the induction data per promoter, showing that different promoters show different scalings of noise and mean expression. (G) The measured expression distribution for the ZRT2 promoter at two different zinc induction levels (50.4 µM and 648 µM zinc, blue and red points in E and G) with the same mean expression level but different distributions. The mean expression level for each distribution is marked with a dashed line.
Figure 2
Figure 2. Measured and modeled gene expression of ZRT1.
(A) ZRT1 expression is modeled with a kinetic scheme in which the promoter switches between a transcriptionally active (on) and inactive (off) state as a result of Zap1 (red oval) binding and unbinding. (B) Experimentally measured ZRT1 promoter-driven expression changes as a function of zinc concentration (triangles). The kinetic model in (A) fits (line) the data (triangles) when zinc is assumed to change Kon (inset). (C) Noise graphed as a function of expression for the data and model from (B). (D) A schematic of the experimental system used to change translation efficiency through mutations of the ATG context. (E) Measured expression distributions for two ATG context variants at three zinc induction levels shows that changing expression via induction or ATG context has a different effect on the shape of the expression distribution. Measured (F, squares) and fit (F, solid lines) of noise as a function of mean expression for three ZRT1 promoter mutants (F, colors) that each has a unique four base-pair sequence immediately upstream of the ATG. A model (F, solid lines) in which the only difference between ATG context variants (different colors) is in the number of proteins produced per mRNA (B) fits the experimental data (squares) better than any alternative model (Figure S6).
Figure 3
Figure 3. Measured and modeled gene expression for ADH1.
We model ADH1 expression using a two-state kinetic scheme (A) in which Kon and Koff are determined by the binding of transcriptional activators (blue circle) or a repressor (red circle). (B) Two mechanisms have been proposed for repression by upstream interfering transcription: TF dislodgment, in which an alternative transcript dislodges the bound activator, and nucleosome occlusion, where transcription through the promoter results in an occluding nucleosome that prevents binding of the activator. Hence, we assume that TF dislodgment increases the dissociation rate of the activator and that nucleosome occlusion results in a decrease in the binding rate of the activator. (C) We fit the model such that either Kon (black) for nucleosome occlusion or Koff (blue) for TF dislodgment changes as a function of [zinc]. (D) Measured mean expression versus noise (triangles) and fits (lines) of both model variants show that the nucleosome occlusion model has a better fit to the data (Δ is distance of fit to data). (E) To compare the robustness of each model, each parameter was independently perturbed 50 times over a 2-fold change from the fit value, and the distance of each model to the data was computed. Shown are the cumulative distributions of these distances. The narrower distribution of the nucleosome occlusion model (black) shows that it is significantly more robust to parameter variation than the TF dislodgment model (blue).
Figure 4
Figure 4. A repressive Zap1 binding site is both necessary and sufficient for repression in ZRT2.
(A) We model ZRT2 expression with a four-state kinetic scheme that represents four promoter configurations as a result of binding and unbinding of Zap1 to two different binding sites. One binding site is activating (blue square) and the other repressing (purple square), and as a result we assume that each configuration can have different transcriptional activity (see Materials and Methods for a detailed description of the model). (B) Promoter architectures are shown in terms of Zap1 binding sites (green), TATA box (purple), TSS (light blue), and nucleosome occupancy (white to grey for increasing occupancy) for wild-type ZRT2 and a ZRT2 mutant (−zre) in which the repressive Zap1 binding site was removed (at the arrow). (C) Measured (triangles and squares) and modeled (lines) mean expression as a function of [zinc] for wild-type ZRT2 (black) and the −zre mutant (blue). (D) The same measured data and model from (C) are shown for mean expression versus noise. The ZRT2 model was simultaneously fitted to the wild-type (C, D, black line) and the mutant (C, D, blue line) with the assumption that the only difference between wild-type and mutant is that the Koffrep of the mutant is infinite, to model the removal of the repressive binding site. Intrinsic noise (D, inset) measured in a dual reporter assay shows the same mean to noise scaling. Two biological replicates for each induction level are shown (points) with a smoothed line drawn through the induction points. (E) The promoter architectures are shown for the wild-type ZRT1 promoter and a +zre mutant in which a repressive Zap1 binding sites was added around the TSS/TATA (at the arrow). (F) Measured mean expression and noise for the ZRT1 wild-type (purple circles) and the +zre mutant (red triangles), and mean expression versus noise strength (inset). The ZRT2 model was simultaneously fitted to both wild-type ZRT1 (purple line) and +zre mutant (red line) again with the assumption that only Koffrep changes as a result of the addition of a repressive binding site. The black bar and inset indicate that a shift in expression occurred without a change in noise consistent with the assumption that the repressive binding site changes the apparent “off” rate and not the “on” rate.
Figure 5
Figure 5. Removal of a predicted repressive Zap1 binding site increases expression of ZRT3.
(A) Promoter architectures are shown for wild-type ZRT3 (wt) and a ZRT3 mutant (−zre) in which a potential repressive Zap1 binding site was removed (at the arrow). Shown are Zap1 binding sites (green), TATA box (purple), TSS (light blue), and nucleosome occupancy (white to grey for increasing occupancy). The potential repressive binding site was predicted using a bioinformatics search. (B) Consistent with this prediction mean expression is higher for the −zre mutant (blue) compared to the wild-type (black). The difference in expression appears only to exist at higher induction, consistent with the idea that repression is a function of Zap1 induction. Further induction of wild-type ZRT3, at very low zinc levels (inset), appears to decrease expression, consistent with a ZRT2-type repressive mechanism in which expression first goes up and then down with increasing TF levels.
Figure 6
Figure 6. Activation and repression by the same TF as a mechanism for noise reduction.
(A) A promoter that is both activated and repressed can be regulated by two different TFs (decoupled; e.g., Gal4-act and Zap1-rep) or one TF (coupled; e.g., Zap1) that functions as both an activator and repressor. (B) A simulation of noise as a result of fluctuations in TF concentration is shown for a coupled (blue) and decoupled (red) system. The y-axis shows noise as a result of TF fluctuations as a function of promoter induction (mean on-switching rate, Kon) for the coupled (blue) and decoupled (red) system. In addition, the mean expression at each induction level is shown (dashed line). Noise from TF fluctuations was quantified by sampling the model at different TF concentrations (i.e., Kon values) that were drawn from a gamma distribution (see Materials and Methods for a detailed description of the model). The model predicts that coupling of activator and repressor (e.g., if they are the same molecule) reduces noise. Notably, reduction is maximal where mean expression peaks (arrow 1). (C) Noise measurements, at various zinc induction levels, of native ZRT2 (blue) and a mutant that has two Gal4 UASs upstream of a repressive Zap1 site (red). The coupled system (wild-type Zrt2) has consistently lower noise than the decoupled system (Gal4-act Zap1-repr), as is predicted by our model. (D) Measurement of extrinsic noise from a dual-reporter assay is shown as a function of zinc induction. Nonstringent gating on cell size (through forward and side scatter) shows an extrinsic noise that is constant with induction (purple). However, strict gating (through a small forward and side scatter gate) significantly reduces the extrinsic noise and reveals a signal that changes with zinc induction (blue). We hypothesize that this signal is determined by noise from TF fluctuations, which according to our model has specific behavior as a function of induction. As predicted by our model we find a reduced noise where mean expression (dashed line) is maximal and sensitivity to TF changes is minimal (B, D, arrow 1), and minimal reduction (maximal extrinsic noise) where mean expression is most sensitive to changes in TF concentration (B, D, arrow 2).
Figure 7
Figure 7. The correlation of noise and noise strength with expression changes with TF concentration.
(A) Scatter plots of noise (top) and noise strength (bottom) graphed against expression for each promoter at low (left side) and high (right side) Zap1 induction points. A line fit to each set of points using linear regression shows that, across promoters, noise strength is uncorrelated with expression at low TF concentration, but is positively correlated with expression at high TF concentration. (B) Noise and noise strength graphed against expression for high and low TF as in (A) but for in silico promoters that differ in both KON and KTL. The change from low to high TF was simulated by multiplying the initial KON of each promoter by 20.

References

    1. Benzer S (1953) Induced synthesis of enzymes in bacteria analyzed at the cellular level. Biochim Biophys Acta 11: 383–395. - PubMed
    1. Newman JRS, Ghaemmaghami S, Ihmels J, Breslow DK, Noble M, et al. (2006) Single-cell proteomic analysis of S. cerevisiae reveals the architecture of biological noise. Nature 441: 840–846 doi:10.1038/nature04785 - DOI - PubMed
    1. Bar-Even A, Paulsson J, Maheshri N, Carmi M, O'Shea E, et al. (2006) Noise in protein expression scales with natural protein abundance. Nat Genet 38: 636–643 doi:10.1038/ng1807 - DOI - PubMed
    1. Taniguchi Y, Choi PJ, Li GW, Chen H, Babu M, et al. (2010) Quantifying E. coli proteome and transcriptome with single-molecule sensitivity in single cells. Science 329: 533–538 doi:10.1126/science.1188308 - DOI - PMC - PubMed
    1. Maheshri N, O'Shea EK (2007) Living with noisy genes: how cells function reliably with inherent variability in gene expression. Annu Rev Biophys Biomol Struct 36: 413–434 doi:10.1146/annurev.biophys.36.040306.132705 - DOI - PubMed

Publication types

MeSH terms