. 2013 Sep;39(5):1377-92.
doi: 10.1037/a0032328. Epub 2013 Apr 8.

Unequal-strength source zROC slopes reflect criteria placement and not (necessarily) memory processes

Affiliations

Unequal-strength source zROC slopes reflect criteria placement and not (necessarily) memory processes

Jeffrey J Starns et al. J Exp Psychol Learn Mem Cogn. 2013 Sep.

Abstract

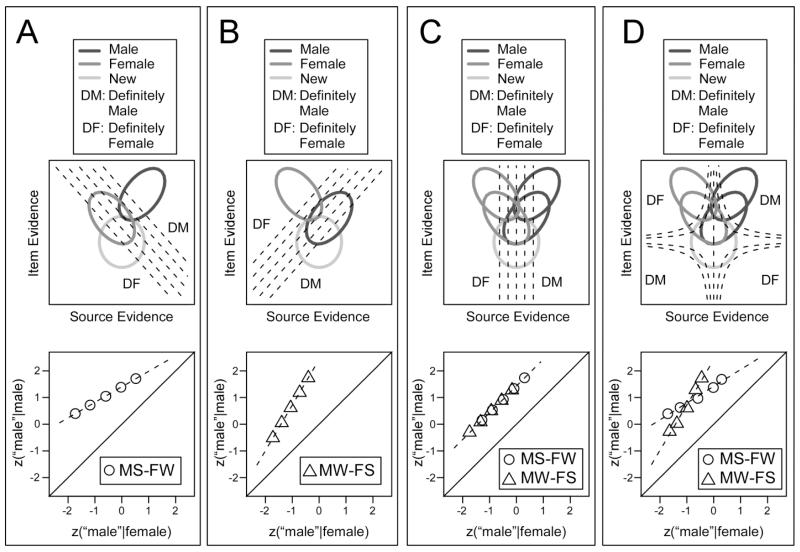
Source memory zROC slopes change from below 1 to above 1 depending on which source gets the strongest learning. This effect has been attributed to memory processes, either in terms of a threshold source recollection process or changes in the variability of continuous source evidence. We propose 2 decision mechanisms that can produce the slope effect, and we test them in 3 experiments. The evidence mixing account assumes that people change how they weight item versus source evidence based on which source is stronger, and the converging criteria account assumes that participants become more willing to make high confidence source responses for test probes that have higher item strength. Results failed to support the evidence mixing account, in that the slope effect emerged even when item evidence was not informative for the source judgment (i.e., in tests that included strong and weak items from both sources). In contrast, results showed strong support for the converging criteria account. This account not only accommodated the unequal-strength slope effect but also made a prediction for unstudied (new) items that was empirically confirmed: participants made more high confidence source responses for new items when they were more confident that the item was studied. The converging criteria account has an advantage over accounts based on source recollection or evidence variability, as the latter accounts do not predict the relationship between recognition and source confidence for new items.


Figures

Figure 1
Figure 1
The continuous model of source memory. Each Gaussian distribution represents source evidence for a particular item type, and the vertical lines show source confidence criteria to divide the evidence space into regions for each confidence level from high-confidence female (furthest to the left) through high-confidence male (furthest to the right). Panel A displays a model in which strong items have both more extreme means and higher standard deviations, and criteria do not vary based on strength. Panel B displays a model in which strong and weak items have the same standard deviation, but the criteria are more tightly grouped for strong items (grey lines) than weak items (black lines). Panels A and B actually display alternative parameterizations of the same model, and they produce exactly the same predicted zROC functions.
Figure 2
Figure 2
Bivariate models for recognition and source responding displaying the alternative decision mechanisms that might produce slope differences with unequal-strength sources. The top plot in each panel shows the model representation, where each oval is an equal-density contour of the bivariate distribution for a given item type and the dashed lines show the source confidence criteria. The “DM” and “DF” symbols demonstrate how the evidence regions are mapped to the “definitely male” and “definitely female” confidence levels, respectively. The bottom plot in each panel shows the source zROC predicted by the displayed model. The predictions were based on 10,000 simulated trials for each item type. MS-FW indicates a function with strong male and weak female items, and MW-FS indicates the reverse. z(“male”|male) indicates the z score for the proportion of male items called “male,” and z(“male”|female) indicates the z score for the proportion of female items called “male.”
Figure 3
Figure 3
Source memory zROC functions from the Unbalanced condition in Experiment 1. MS-FW indicates a function with strong male and weak female items, and MW-FS indicates the reverse. Plusses mark the fit of the continuous model with unequal varainces (UV), and x’s mark the fit of the dual process (DP) model. z(“male”|male) indicates the z score for the proportion of male items called “male,” and z(“male”|female) indicates the z score for the proportion of female items called “male.”
Figure 4
Figure 4
Source memory zROC functions from the Balanced condition in Experiment 1. The first plot shows the unequal-strength zROCs, and the second shows equal-strength zROCs (the same data are displayed in each plot). Plusses mark the fit of the continuous model with unequal variances (UV), and x’s mark the fit of the dual process (DP) model. z(“male”|male) indicates the z score for the proportion of male items called “male,” and z(“male”|female) indicates the z score for the proportion of female items called “male.” MS – male strong; MW – male weak; FS – female strong; FW – female weak.
Figure 5
Figure 5
Source confidence for new (unstudied) items in recognition/source datasets from other studies (see the Appendix for a description of the studies). Each plot shows results from a single dataset (DS) with a bar for each level of confidence that the item was studied (“not studied” responses are not shown). The proportion of source responses at each confidence level are displayed in different colors, with the lightest shade representing the lowest confidence level and the darkest representing the highest. Responses were collapsed across source; for example, the black bar represents high confidence claims for either Source 1 or Source 2.
Figure 6
Figure 6
Source memory zROC functions from Experiments 2a and 2b. The first plot for each experiment shows the unequal-strength zROCs, and the second shows equal strength zROCs (the same data are displayed in each plot). Plusses mark the fit of the continuous model with unequal variances (UV), and x’s mark the fit of the dual process (DP) model. z(“male”|male) indicates the z score for the proportion of male items called “male,” and z(“male”|female) indicates the z score for the proportion of female items called “male.” MS – male strong; MW – male weak; FS – female strong; FW – female weak.
Figure 7
Figure 7
Source confidence for new (unstudied) items in Experiments 2a and 2b. Each plot has a bar for each level of confidence that the item was studied (new items that were called “unstudied” did not appear on the source test). The proportion of source responses at each confidence level are displayed in different colors, with the lightest shade representing the lowest confidence level and the darkest representing the highest. Responses were collapsed across source; for example, the black bar represents high confidence claims for either Male or Female.

References

    1. Akaiki H. Information theory as an extension of the maximum likelihood principle. In: Petrov BN, Csaki F, editors. Second International Symposium on Information Theory. Akademiai Kiado; Budapest: 1973. pp. 267–281.
    1. Ashby FG, Townsend JT. Varieties of perceptual independence. Psychological Review. 1986;93:154–179. - PubMed
    1. Banks WP. Recognition and source memory as multivariate decision processes. Psychological Science. 2000;11:267–273. - PubMed
    1. Benjamin AS, Diaz M, Wee S. Signal detection with criterion noise: Applications to recognition memory. Psychological Review. 2009;116:84–115. - PMC - PubMed
    1. Bröder A, Schütz J. Recognition ROCs are curvilinear – or are they? On premature arguments against the two-high-threshold model of recognition. Journal of Experimental Psychology: Learning, Memory, and Cognition. 2009;35:587–606. - PubMed

Publication types