

Glomerular input patterns in the mouse olfactory bulb evoked by retronasal odor stimuli
- PMID: 23565900
- PMCID: PMC3626767
- DOI: 10.1186/1471-2202-14-45
Glomerular input patterns in the mouse olfactory bulb evoked by retronasal odor stimuli
Abstract
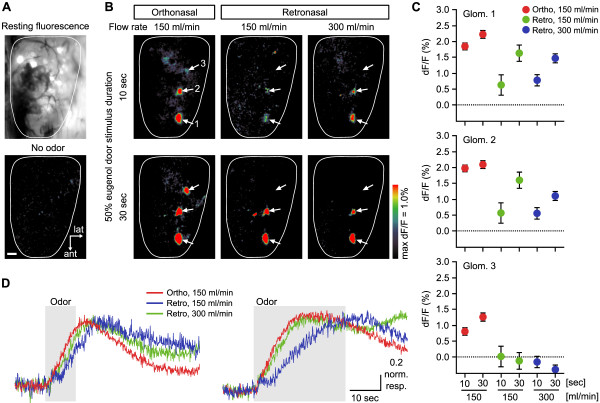
Background: Odorant stimuli can access the olfactory epithelium either orthonasally, by inhalation through the external nares, or retronasally by reverse airflow from the oral cavity. There is evidence that odors perceived through these two routes can differ in quality and intensity. We were curious whether such differences might potentially have a neural basis in the peripheral mechanisms of odor coding. To explore this possibility, we compared olfactory receptor input to glomeruli in the dorsal olfactory bulb evoked by orthonasal and retronasal stimulation. Maps of glomerular response were acquired by optical imaging of transgenic mice expressing synaptopHluorin (spH), a fluorescent reporter of presynaptic activity, in olfactory nerve terminals.
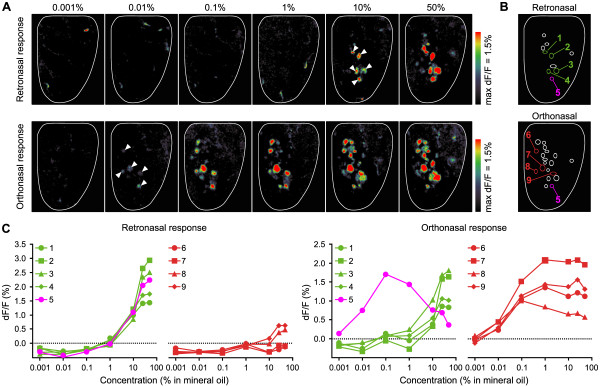
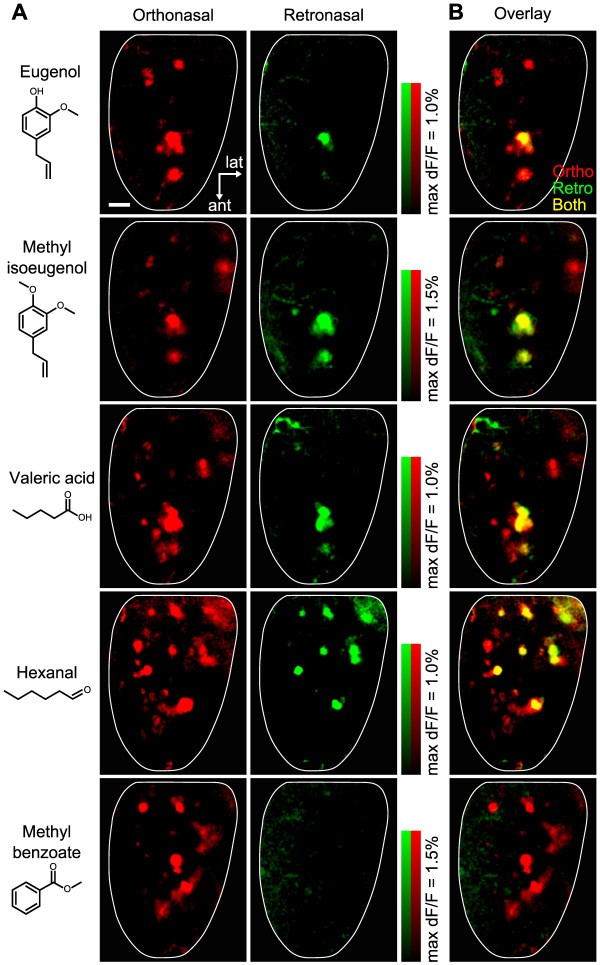
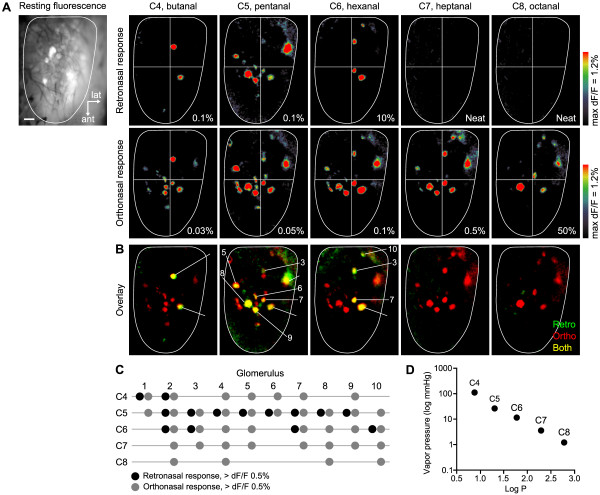
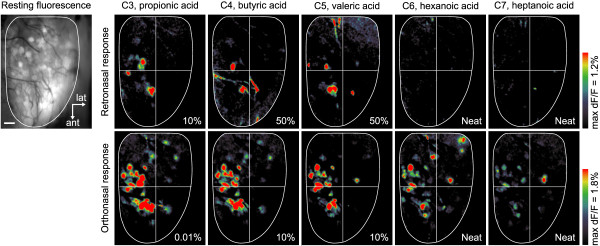
Results: We found that retronasally delivered odorants were able to activate inputs to multiple glomeruli in the dorsal olfactory bulb. The retronasal responses were smaller than orthonasal responses to odorants delivered at comparable concentrations and flow rates, and they displayed higher thresholds and right-shifted dose-response curves. Glomerular maps of orthonasal and retronasal responses were usually well overlapped, with fewer total numbers of glomeruli in retronasal maps. However, maps at threshold could be quite distinct with little overlap. Retronasal responses were also more narrowly tuned to homologous series of aliphatic odorants of varying carbon chain length, with longer chain, more hydrophobic compounds evoking little or no response at comparable vapor levels.
Conclusions: Several features of retronasal olfaction are possibly referable to the observed properties of glomerular odorant responses. The finding that retronasal responses are weaker and sparser than orthonasal responses is consistent with psychophysical studies showing lower sensitivity for retronasal olfaction in threshold and suprathreshold tests. The similarity and overlap of orthonasal and retronasal odor maps at suprathreshold concentrations agrees with generally similar perceived qualities for the same odorant stimuli administered by the two routes. However, divergence of maps near threshold is a potential factor in perceptual differences between orthonasal and retronasal olfaction. Narrower tuning of retronasal responses suggests that they may be less influenced by chromatographic adsorption effects.
Figures

Similar articles
-
Retronasal odor concentration coding in glomeruli of the rat olfactory bulb.Front Integr Neurosci. 2014 Oct 24;8:81. doi: 10.3389/fnint.2014.00081. eCollection 2014. Front Integr Neurosci. 2014. PMID: 25386123 Free PMC article.
-
Orthonasal versus retronasal glomerular activity in rat olfactory bulb by fMRI.Neuroimage. 2020 May 15;212:116664. doi: 10.1016/j.neuroimage.2020.116664. Epub 2020 Feb 20. Neuroimage. 2020. PMID: 32087375 Free PMC article.
-
Retronasal odor representations in the dorsal olfactory bulb of rats.J Neurosci. 2012 Jun 6;32(23):7949-59. doi: 10.1523/JNEUROSCI.1413-12.2012. J Neurosci. 2012. PMID: 22674270 Free PMC article.
-
Processing of Odor Information During the Respiratory Cycle in Mice.Front Neural Circuits. 2022 Mar 31;16:861800. doi: 10.3389/fncir.2022.861800. eCollection 2022. Front Neural Circuits. 2022. PMID: 35431818 Free PMC article. Review.
-
Retronasal Olfaction Test Methods: A Systematic Review.Balkan Med J. 2019 Jan 1;36(1):49-59. doi: 10.4274/balkanmedj.2018.0052. Epub 2018 Sep 28. Balkan Med J. 2019. PMID: 30264731 Free PMC article.
Cited by
-
Differences in olfactory bulb mitral cell spiking with ortho- and retronasal stimulation revealed by data-driven models.PLoS Comput Biol. 2021 Sep 20;17(9):e1009169. doi: 10.1371/journal.pcbi.1009169. eCollection 2021 Sep. PLoS Comput Biol. 2021. PMID: 34543261 Free PMC article.
-
Retronasal odor concentration coding in glomeruli of the rat olfactory bulb.Front Integr Neurosci. 2014 Oct 24;8:81. doi: 10.3389/fnint.2014.00081. eCollection 2014. Front Integr Neurosci. 2014. PMID: 25386123 Free PMC article.
-
Retronasal Odor Perception Requires Taste Cortex, but Orthonasal Does Not.Curr Biol. 2019 Jan 7;29(1):62-69.e3. doi: 10.1016/j.cub.2018.11.011. Epub 2018 Dec 20. Curr Biol. 2019. PMID: 30581018 Free PMC article.
-
Orthonasal versus retronasal glomerular activity in rat olfactory bulb by fMRI.Neuroimage. 2020 May 15;212:116664. doi: 10.1016/j.neuroimage.2020.116664. Epub 2020 Feb 20. Neuroimage. 2020. PMID: 32087375 Free PMC article.
-
Odor modality is transmitted to cortical brain regions from the olfactory bulb.J Neurophysiol. 2023 Nov 1;130(5):1226-1242. doi: 10.1152/jn.00101.2023. Epub 2023 Oct 4. J Neurophysiol. 2023. PMID: 37791383 Free PMC article.
References
-
- Hummel T, Heilmann S, Landis BN, Reden J, Frasnelli J, Small DM. Perceptual differences between chemical stimuli presented through the ortho- or retronasal route. Flavour Frag J. 2006;21:42–47. doi: 10.1002/ffj.1700. - DOI
-
- Voirol E, Daget N. Comparative study of nasal and retronasal olfactory perception. Food Sci Technol. 1986;19:316–319.
-
- Heilmann S, Hummel T. A new method for comparing orthonasal and retronasal olfaction. Behav Neurosci. 2004;118:412–419. - PubMed
Publication types
MeSH terms
Substances
LinkOut - more resources
Full Text Sources
Other Literature Sources
