Review
. 2014 Jan:29:568-81.
doi: 10.1016/j.jmbbm.2013.02.018. Epub 2013 Mar 14.

Mechanical forces in cerebral cortical folding: a review of measurements and models

Affiliations
Review

Mechanical forces in cerebral cortical folding: a review of measurements and models

P V Bayly et al. J Mech Behav Biomed Mater. 2014 Jan.

Abstract

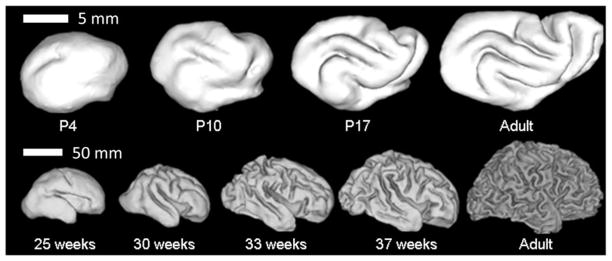
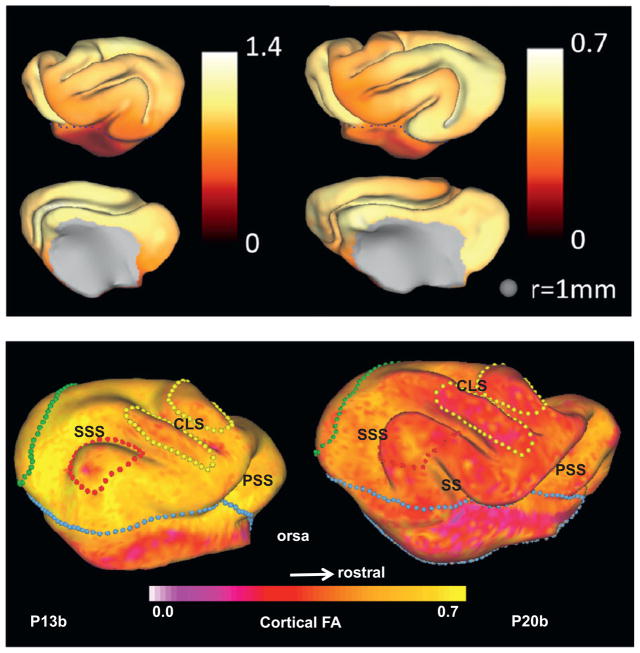
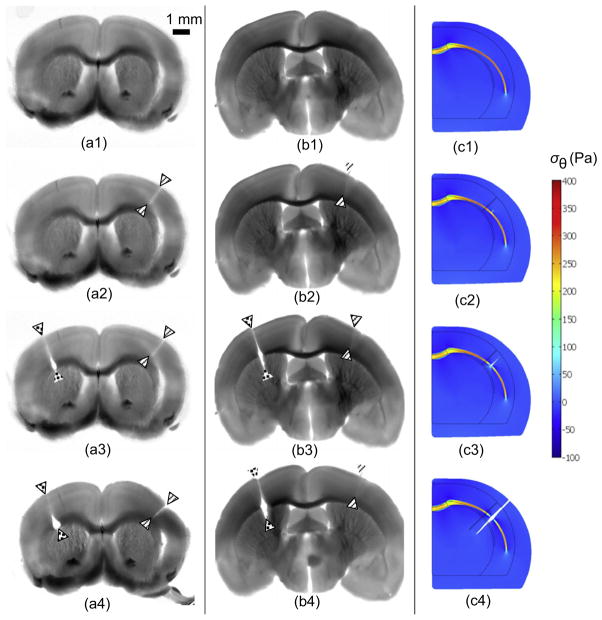
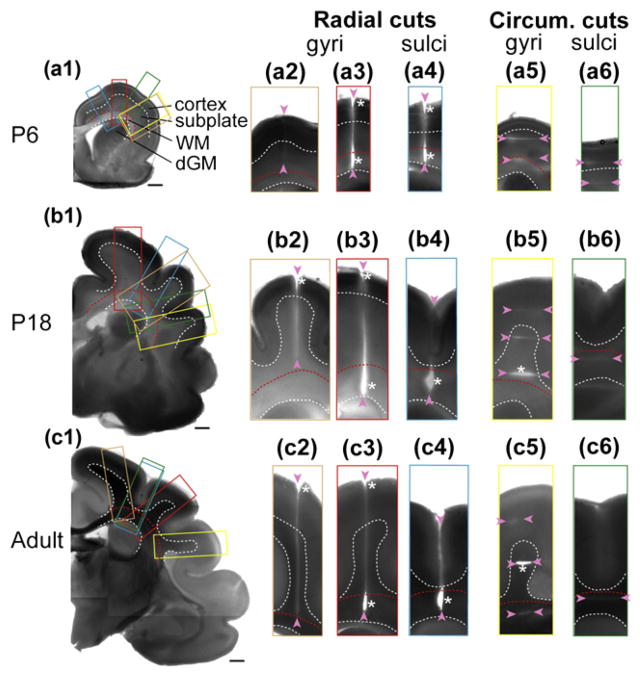
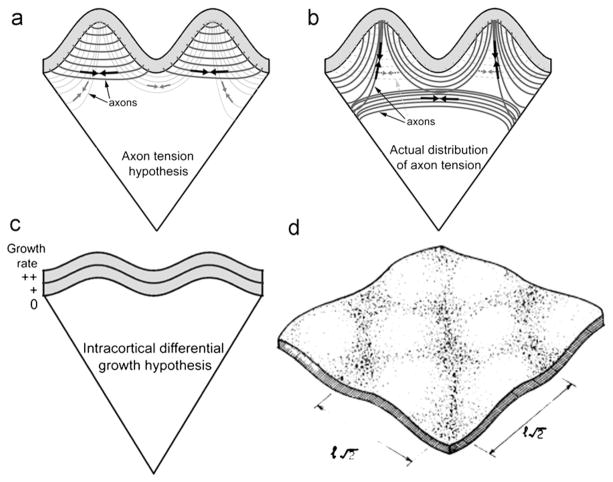
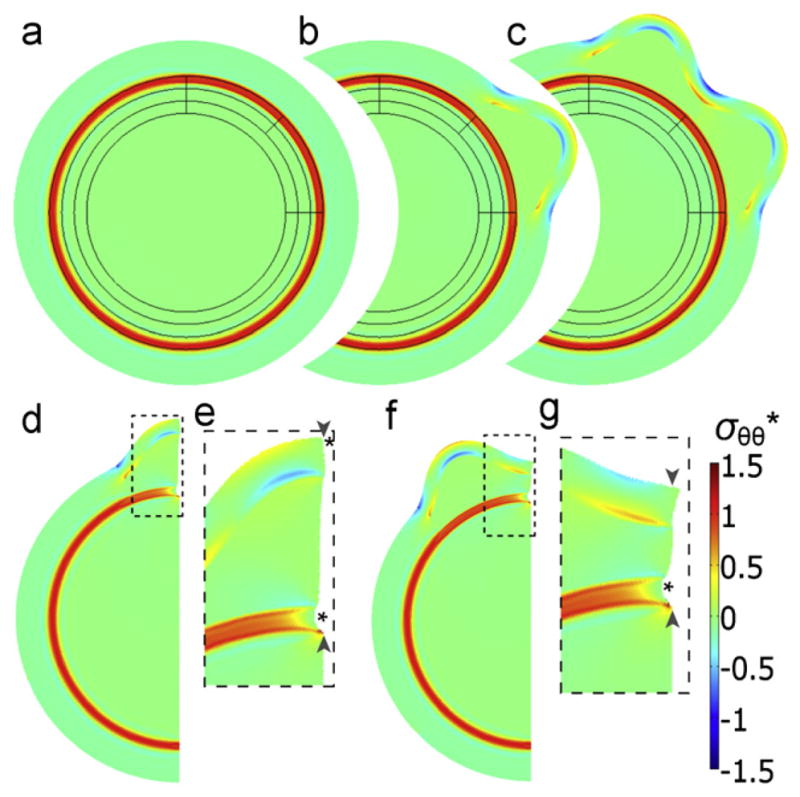
Folding of the cerebral cortical surface is a critical process in human brain development, yet despite decades of indirect study and speculation the mechanics of the process remain incompletely understood. Leading hypotheses have focused on the roles of circumferential expansion of the cortex, radial growth, and internal tension in neuronal fibers (axons). In this article, we review advances in the mathematical modeling of growth and morphogenesis and new experimental data, which together promise to clarify the mechanical basis of cortical folding. Recent experimental studies have illuminated not only the fundamental cellular and molecular processes underlying cortical development, but also the stress state and mechanical behavior of the developing brain. The combination of mathematical modeling and biomechanical data provides a means to evaluate hypothesized mechanisms objectively and quantitatively, and to ensure that they are consistent with physical law, given plausible assumptions and reasonable parameter values.


Figures

Fig. 1
Fig. 1
Surface representations obtained from MR images of (A) ferret brains at postnatal day 4, 10, 17, and at maturity, and (B) human brains at 25, 30, 33, and 39 weeks gestation and in the adult. Reproduced with permission from Barnette et al. (2009).
Fig. 2
Fig. 2
Neuronal differentiation and arborization coincide with the period of cerebral cortical folding. In the ferret, both morphological differentiation and folding occurs during the first five weeks of life. Neural traces are from Zervas and Walkley (1999) and are reproduced with permission.
Fig. 3
Fig. 3
(a) Coronal sections of ferret brains fixed at 2, 6, and 10 days after birth (P2, P6, and P10). Reproduced with permission from Smart and McSherry (1986a). (b) Line drawings of tissue deformations during folding, from Smart and McSherry (1986b). Lines show radial tissue lines and layers in the tangentially expanding cortex; stippling shows neurons in the subplate (the layer immediately below the cortical plate). Reproduced with permission from Smart and McSherry,(1986b).
Fig. 4
Fig. 4
Fractional anisotropy of the diffusion tensor (measured by diffusion-weighted MR imaging) decreases during folding, as normalized mean curvature (*) and normalized sulcal depth (Δ̄*) increase. FA, * and Δ̄* are all dimensionless. Adapted with permission from Knutsen et al. (2012).
Fig. 5
Fig. 5
(a) Maps of local relative cortical growth, ΔA = (A2A1)/A1 from P14 to P21 (left) and P21 to P28 (right) in the left hemisphere of one ferret. While the isocortex expands at a roughly constant rate after about P13, relative cortical growth is larger from P14 to P21 because cortical growth represents the change in local surface area relative to the initial local surface area. Growth was not calculated on the medial wall, which is shown in gray. Reproduced with permission from Knutsen et al. (2012). (b) Regional variations of cortical fractional anisotropy (FA) in the developing ferret brain. FA decreases with age over the first postnatal month (Kroenke et al., 2009). Here, cortical FA is projected onto P13b and P20b ferret brain cortical surface models, respectively. Boundaries between important cortical regions are marked by color-coded spheres on each surface: the isocortical/allocortical boundary (light blue); primary visual cortex (green); auditory cortex (red) and somatosensory area (yellow). Adapted with permission from Kroenke et al. (2009). (For interpretation of the references to color in this figure legend, the reader is referred to the web version of this article.)
Fig. 6
Fig. 6
Micro-dissection study of stress in a coronal slice of an adult mouse brain. (a1, b1) Brain section before dissection (1 mm thick, obtained by vibratome immediately after sacrifice). (a2, b2) One radial cut (solid arrowheads) was made only through the cortical gray matter, and did not open. (a3, b3) A second radial cut (open arrowheads) was made through the underlying white matter (a3) or into the interior gray matter (b3). The cut opened at the site of the white matter tract. (a4, b4). (c1–c4) Normalized circumferential stress ( σθ) distribution in finite element models of the dissection experiments (μ*=0.5, λg=1.3). Following imposed growth, gray matter is in compression and white matter is in tension. Simulated radial cuts were made into cortical gray matter (c2), white matter (c3), or deep gray matter (c4), respectively. Reproduced with permission from Xu et al. (2009).
Fig. 7
Fig. 7
Microdissection study of the ferret brain before, during, and after the period of folding. (a1–c1) Coronal brain sections at postnatal day (P) 6, 18, and adult. Dashed curves outline the boundaries between cortex, subplate, subcortical white matter (WM), and deep grey matter (dGM). Scale bars represent 1 mm. Color-coded rectangles indicate the regions shown in the close-ups to the right of each section. Cuts of various depths (indicated by pairs of arrowheads) are made either radially (a2–a4, b2–b4, and c2–c4) or circumferentially (a5–a6, b5–b6, and c5–c6) on developing gyri and sulci as marked. Asterisks indicate significant openings. Reproduced with permission from Xu et al. (2010).
Fig. 8
Fig. 8
(a) A schematic representation of the axonal tension hypothesis of cortical folding (Van Essen, 1997). Tension (black arrows) in axons that connect two cortical regions is hypothesized to pull them closer to each other, forming an outward fold. Inward folds are hypothesized to form between weakly interconnected cortical regions (grey arrows). Adapted with permission from Xu et al. (2010) following Van Essen (1997). (b) Actual distributions of axon tension based on dissection and histology data (Xu et al., 2010). Axons are under tension (black arrows). Tension is manifested circumferentially in the subcortical white matter tract and radially in the subplate or the cores of outward folds (apparent after P18). Circumferential tension (grey arrows) was not detected between the walls of outward folds. Adapted with permission from Xu et al. (2010). (c) Intracortical differential tangential growth model due to Richman et al. (1975). Brain cortex is roughly divided into two layers with the outer layer growing faster (indicated by “++”) than the inner layer (“+”). All other underlying tissue is treated as a softer elastic foundation without any growth. Adapted with permission from Richman et al. (1975) and Xu et al. (2010). (d) This differential growth model predicts elastic buckling of the outer layer. Reproduced with permission from Richman et al. (1975). (For interpretation of the references to color in this figure legend, the reader is referred to the web version of this article.)
Fig. 9
Fig. 9
Buckling deformation maps of stiff-shelled spheroids with equatorial radius α, polar radius b, and shell thickness t, from Yin et al. (2008). The radius of curvature at the pole is R=a2/b and the shape factor k=a/b. Deformations of the outer shell are shown as shape factor k and ratio of stress in the film (shell) to critical buckling stress (σf/σc) are varied. The radius/thickness ratio R/t =20 and the modulus ratio between film and substrate Ef/Es = 30 are both held constant. The amplitude of the mode in each image is arbitrary; the color red indicates relatively concave regions. Reproduced with permission from Yin et al. (2008). (For interpretation of the references to color in this figure legend, the reader is referred to the web version of this article.)
Fig. 10
Fig. 10
(A) A cusped structure representative of folding instability in a differentially swelling gel specimen (Dervaux et al., 2011). The outer ring (width H) swells while the inner disk (radius A) does not. (B)–(E) Experimental samples with ratios of ring width/internal disk radius ratio H/A≈0.13. The ratio of shear modulus in the disk to shear modulus in the ring increases from left to right: 0.25, 0.5, 1, 6). (F)–(I) Corresponding theoretical predictions. Reproduced with permission from Dervaux et al. (2011).
Fig. 11
Fig. 11
Effects of cortical growth rate on wavelength, subcortical growth, and stress in a 2-D model of cortical folding. In this model folding is driven by tangential growth of a single outer layer, accompanied by stress-driven radial and tangential growth in the foundation (Bayly et al., 2013). The elastic shear modulus is the same in both regions. Each column contains spatial maps of a different variable superimposed on the deformed geometry: radial growth Gr; tangential growth Gt; radial stress σr; tangential stress σt. Each row corresponds to a different scaled cortical growth rate. (Row 1)Relative growth rate ΓG = 2.5 × 10⁻², at scaled time τ=0.060; (Row 2) ΓG = 2.5 × 10⁻³, at τ=0.035; (Row 3) ΓG = 2.5 × 10⁻⁴, at τ=0.014; (Row 4) τ = 2.5 × 10⁻⁵, at τ =0.08. Reproduced with permission from Bayly et al. (2013).
Fig. 12
Fig. 12
The effects of cortical growth rate and initial shape in an axisymmetric model of folding caused by tangential growth of the outer layer and stress-induced growth in internal regions. The initial shape (column 1) is determined by imposing a specific pattern of radial growth GR before the period of rapid tangential expansion. The next three columns show maps of radial growth GR; tangential growth Gt; and radial stress σr superimposed on the deformed domain. Two different relative growth rates lead to qualitatively different final shapes. Row 1: relative growth rate ΓG = 0.50, at time τ =0.90. Row 2: G = 0.20, at time τ=1.25. Reproduced with permission from Bayly et al. (2013).
Fig. 13
Fig. 13
Two-dimensional finite element model of cortical folding caused by phased differential growth. In this model folding at specific locations is produced by spatial variations in the time of local expansion. (a)–(c) Model geometry and stress distribution (a) after contraction of a sub-cortical band of white matter, and before expansion of the outer cortical layer; and (b)–(c) after each of two local tangential expansions leading to the formation of two gyri. (d)–(g) A section of the model shown in (c) was used to simulate the effects of subsequent radial cuts within a gyrus (d and e) and a sulcus (f and g). Simulated cuts through the subcortical white matter tract (pairs of arrowheads) lead to openings (indicated by asterisks). Panels (e) and (g) are magnified images of the outlined regions in (d) and (f), respectively. Colors indicate circumferential stress (σ*) normalized by the material shear modulus. Reproduced with permission from Xu et al., (2010). (For interpretation of the references to color in this figure legend, the reader is referred to the web version of this article.)

References

    1. Alford PW, Taber LA. Computational study of growth and remodelling in the aortic arch. Computer Methods in Biomechanics and Biomedical Engineering. 2008;11:525–538. - PMC - PubMed
    1. Barnette AR, Neil JJ, Kroenke CD, Griffith JL, Epstein AA, Bayly PV, Knutsen AK, Inder TE. Characterization of brain development in the ferret via MRI. Pediatric Research. 2009;66:80–84. - PMC - PubMed
    1. Barron DH. An experimental analysis of some factors involved in the development of the fissure pattern of the cerebral cortex. Journal of Experimental Zoology. 1950;113:553–581.
    1. Basser PJ, Pierpaoli C. Microstructural and physiological features of tissues elucidated by quantitative-diffusion-tensor MRI. Journal of Magnetic Resonance, Series B. 1996;111:209–219. - PubMed
    1. Bayly PV, Okamoto RJ, Xu G, Shi Y, Taber LA. A cortical folding model incorporating stress-dependent growth explains gyral wavelengths and stress patterns in the developing brain. Physical Biology. 2013;10 (1):016005. - PMC - PubMed

Publication types

LinkOut - more resources