. 2013:3:1620.
doi: 10.1038/srep01620.

Intra-membrane signaling between the voltage-gated Ca2+-channel and cysteine residues of syntaxin 1A coordinates synchronous release

Affiliations

Intra-membrane signaling between the voltage-gated Ca2+-channel and cysteine residues of syntaxin 1A coordinates synchronous release

Niv Bachnoff et al. Sci Rep. 2013.

Abstract

The interaction of syntaxin 1A (Sx1A) with voltage-gated calcium channels (VGCC) is required for depolarization-evoked release. However, it is unclear how the signal is transferred from the channel to the exocytotic machinery and whether assembly of Sx1A and the calcium channel is conformationally linked to triggering synchronous release. Here we demonstrate that depolarization-evoked catecholamine release was decreased in chromaffin cells infected with semliki forest viral vectors encoding Sx1A mutants, Sx1A(C271V), or Sx1A(C272V), or by direct oxidation of these Sx1A transmembrane (TM) cysteine residues. Mutating or oxidizing these highly conserved Sx1A Cys271 and Cys272 equally disrupted the Sx1A interaction with the channel. The results highlight the functional link between the VGCC and the exocytotic machinery, and attribute the redox sensitivity of the release process to the Sx1A TM C271 and C272. This unique intra-membrane signal-transduction pathway enables fast signaling, and triggers synchronous release by conformational-coupling of the channel with Sx1A.


Figures

Figure 1
Figure 1. Expressing GFP, wt Sx1A, and Sx1A mutant Sx1AC271V, Sx1AC272V and Sx1AC145A by SFV vectors in bovine chromaffin cells.
(a) Chromaffin cells were infected with SFV vectors of GFP, RFP-Sx1A wt, RFP-Sx1ACC/VV, RFP-Sx1AC271V, RFP-Sx1AC272V and RFP-Sx1AC145A. The cells were visualized by confocal microscopy (b) Western blot analysis of Sx1A expression was determined in cell lysates from chromaffin cells infected with SFV-GFP, RFP-wt Sx1A, RFP-Sx1ACC/VV (upper), RFP-Sx1AC271V or RFP-Sx1AC272V or RFP-Sx1AC145A (lower) (c) Quantification of the relative expression of RFP-wtSx1A and RFP-Sx1A mutants to endogenous Sx1A present in the cells.
Figure 2
Figure 2. Sx1ACC/VV mutant affects depolarization evoked secretion in bovine chromaffin cells.
(a) Sample amperometry traces for control, GFP-infected, RFP wt Sx1A infected, and RFP-Sx1ACC/VV infected cells elicited by a puff of K60, indicated by the arrow (b) Left, Cumulative spike counts were plotted versus time to illustrate the time course of secretion triggered by depolarization (starting at t = 10). Right, expanded view of the initial cumulative spike counts shown in b left (c) Left, average number of spikes per cell. Middle, The average area underneath the spikes represents the total mean charge (total CA secretion) and is presented as the percentage of average secretion per cell. Right, the mean frequency of the initial rate was calculated as the maximum slope in plot b right, during the first 30 sec of recording (Table II). **p < 0.005.
Figure 3
Figure 3. Sx1A mutants Sx1AC271V, and Sx1AC272V affect secretion rate in bovine chromaffin cells.
(a) Sample amperometry traces for GFP, and RFP-Sx1AC271V, RFP-Sx1AC272V, and RFP-Sx1AC145A mutants elicited by a puff of K60 (arrow) (b) Left, Cumulative spike counts were plotted versus time to illustrate the time course of fusion triggered by depolarization (starting at t = 10). Right, expanded view of the initial cumulative spike counts. The mean frequency of the initial rate was calculated as the maximum slope in plot b left during the first 20 s of K60 stimulation (Table II) (c) Left, average number of spikes per cell (Table II), Middle, the average area underneath the spikes represents the total mean charge (total CA secretion) and is presented as the percentage of average secretion per cell. Right, the mean frequency of the initial rate was calculated as the maximum slope in plot b right, during the first 30s of recording. **p < 0.05; ***p < 0.005.
Figure 4
Figure 4. Different mutations in C271, C272 of Sx1A are expressed and targeted to the membrane of Xenopus laevis oocytes affecting current flow through Cav1.2 channel.
(a) Confocal images of oocytes expressing RFP-tagged wt Sx1A and RFP-tagged Sx1ACC/VV, Sx1ACC/SS, Sx1ACC/AA mutants (b) Schematic depiction of TMD location of the Sx1A Cys271, and Cys272 Sx1A residues (c) Western blot analysis of RFP-wt and RFP-Sx1A mutants expressed in Xenopus oocytes and a bovine brain sample, as indicated. Blots were incubated with anti-Sx1A antibody. (d) Representative superimposed α11.2/β2/α2δ current traces (Cav1.2) in the absence and in the presence of RFP-Sx1A (left); RFP-Sx1ACC/AA (middle-left); RFP-Sx1ACC/SS (middle-right) and RFP-Sx1ACC/VV (right) (e) Leak subtracted current-voltage relationships of α11.2/β2/α2δ expressed either alone (formula image
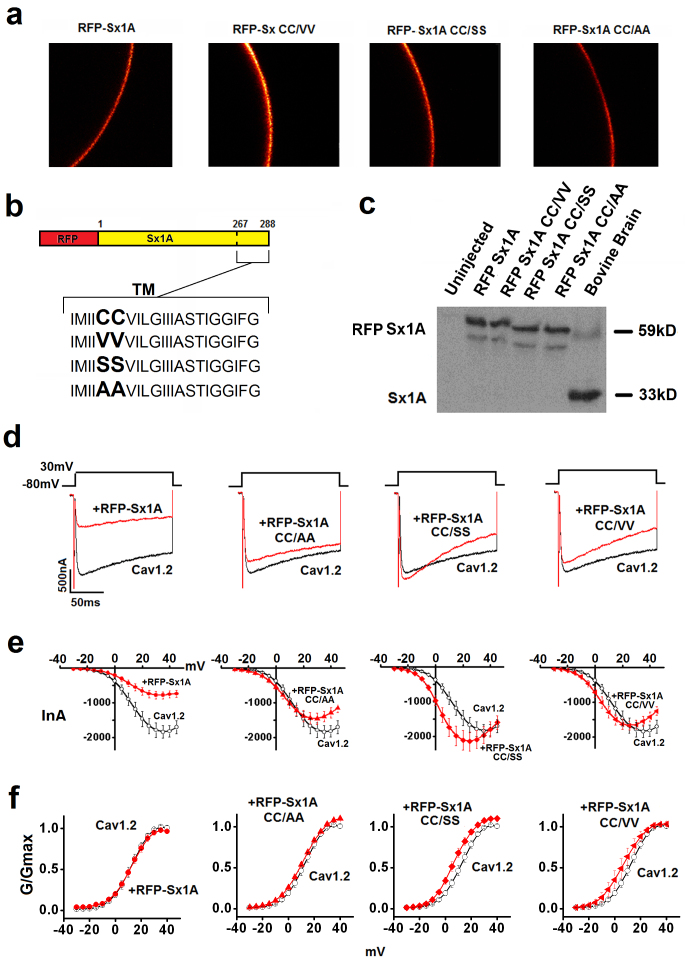
) or with RFP-Sx1A (formula image, left); RFP-Sx1ACC/AA (formula image, middle-left); RFP-Sx1ACC/SS (formula image, middle-right); RFP-Sx1ACC/VV (formula image, right). (f) Voltage-conductance (G/Gmax) analysis of α11.2/β2/α2δ expressed either alone or with the different mutants, as indicated in B. The data points correspond to the mean ± SEM of currents (n = 12–14). Individual data points are mean ± SEM (n = 12–14). The results were fitted to the sigmoidal Boltzmann equation.
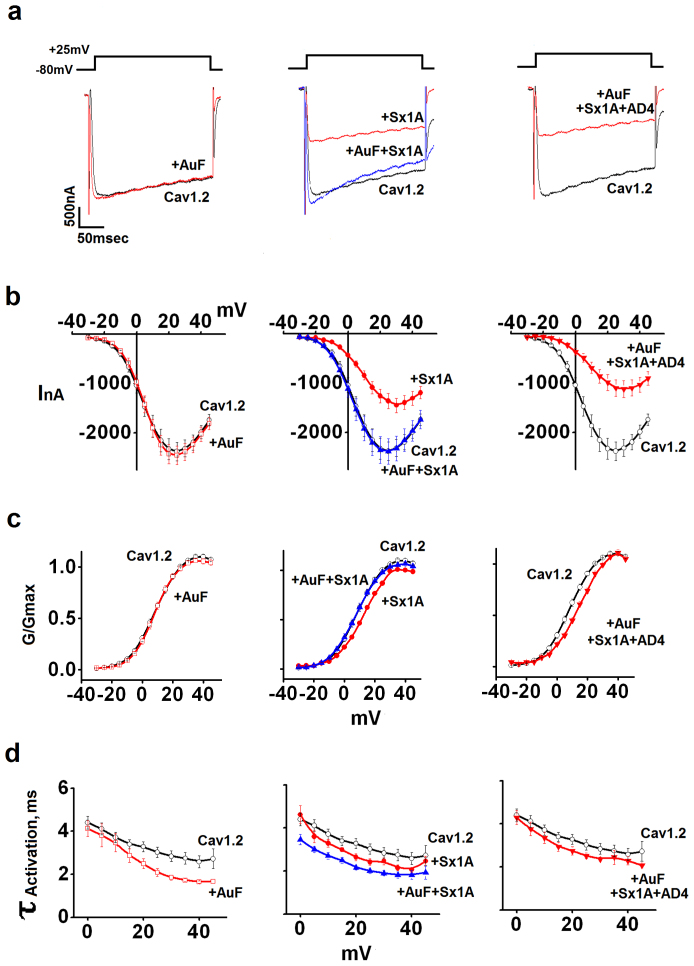
Figure 5
Figure 5. The interaction between Sx1A and Cav1.2 is abolished by AuF and restored by AD4 (NAC-amide).
(a) Representative superimposed α11.2/β2/α2δ current traces (Cav1.2) in the absence and in the presence of AuF (left); Sx1A/Sx1A + AuF as indicated (middle) or Sx1A+AuF+AD4 (right). (b) Leak subtracted current-voltage relationships of α11.2/β2/α2δ expressed either alone (formula image) or with AuF (formula image, left); Sx1A/Sx1A + AuF (formula image/formula image, middle) or Sx1A+AuF+AD4 (formula image, right). Inward Ca2+ currents were evoked from a holding potential of −80 mV to various test potentials in response to 200 ms test pulse at 5 mV increments. (c) G/Gmax values as indicated in b (d) τ activation values as indicated in b. The data points correspond to the mean ± SEM of currents (n = 8–15).
Figure 6
Figure 6. AuF affects Sx1A availability for Biotin-NM and results in reduced strep-avidin pull down in chromaffin cells and in Xenopus oocytes.
(a) Schematic depiction of the modified Biotin-NM assay followed by strep-avidin pull-down. (b) Bovine chromaffin cells treated with either AuF or AuF followed by AD4, or CB3 as indicated. Cells were subjected to the modified Biotin-NM assay followed by strep-avidin pull-down and separated on SDS-PAGE (upper). Quantification of Sx1A pull-down with streptavidin (lower) (c) Xenopus oocytes, injected with cRNA encoding for RFP-Sx1A C145A, were treated with AuF followed by AD4, or CB3 or CB4 (TXM) as indicated. (d) Xenopus oocytes, injected with cRNA encoding for RFP-Sx1A C271V/C272V (CC/VV), were treated with or without AuF. All oocytes were lysed and subjected to the modified Biotin-NM assay followed by Strep-avidin pull-down and separation on SDS-PAGE (upper). Quantification of Sx1A pull-down with strep-avidin (lower). The data points correspond to the mean ± SEM (n = 3). Two sample Student's t-test assuming unequal variance was applied and p values were obtained from two tailed test; *p < 0.05, **p < 0.01, ***p < 0.001.
Figure 7
Figure 7. Sx1A binds AuF detected by gold atoms using mass spectrometry.
(a) Schematic depiction of the pull-down assay. His-tag RFP-Sx1AC145A was expressed in Xenopus oocytes bound to AuF and pulled-down by Ni2+ beads. (b) Western blot analysis of His-tag RFP-Sx1AC145A pulled down with Ni2+ beads. (c) Schematic depiction of element detection via mass spectrometry. (d) Gold (Au197) detection (counts per second, CPS) via mass spectrometry of oocytes either injected (Sx1A) or un-injected (Un) with cRNA of His-tag-RFP-Sx1AC145A. Oocytes were treated with AuF as indicated. Lysates were subjected to pull-down as described in a.
Figure 8
Figure 8. Schematic presentation of an intra-membrane cross talk between wt Sx1A or Sx1A single mutants with the α1 subunit of VGCC.
(a) Interaction between the calcium channel and Sx1A occurs through the SH group of TM Cys271 and Cys272 (for simplicity only two Sx1A molecules and a single channel are shown). (b) Mutating or oxidizing the Cys residues disrupts the transmembrane interaction between Sx1A and the channel yielding ‘inefficient’ contact with the channel, and affects evoked release. The cytosolic Sx1A/channel interaction is not affected by the redox state of the Sx1A TM domain cysteines.

References

    1. Atlas D. Signaling role of the voltage-gated calcium channel as the molecular on/off-switch of secretion. Cell Signal 22, 1597–1603 (2010). - PubMed
    1. Atlas D. The Voltage-Gated Calcium Channel Functions as the Molecular Switch of Synaptic Transmission. Annu Rev Biochem 82 (2013). - PubMed
    1. Sheng Z. H., Rettig J., Takahashi M. & Catterall W. A. Identification of a syntaxin-binding site on N-type calcium channels. Neuron 13, 1303–1313 (1994). - PubMed
    1. Wiser O., Tobi D., Trus M. & Atlas D. Synaptotagmin restores kinetic properties of a syntaxin-associated N-type voltage sensitive calcium channel. FEBS Lett 404, 203–207 (1997). - PubMed
    1. Wiser O., Bennett M. K. & Atlas D. Functional interaction of syntaxin and SNAP-25 with voltage-sensitive L- and N-type Ca2+ channels. EMBO J 15, 4100–4110 (1996). - PMC - PubMed

Publication types

MeSH terms

LinkOut - more resources