. 2013 Jun;21(6):1169-81.
doi: 10.1038/mt.2013.55. Epub 2013 Apr 9.

Liposome delivery of microRNA-145 to mesenchymal stem cells leads to immunological off-target effects mediated by RIG-I

Affiliations

Liposome delivery of microRNA-145 to mesenchymal stem cells leads to immunological off-target effects mediated by RIG-I

Tommy A Karlsen et al. Mol Ther. 2013 Jun.

Abstract

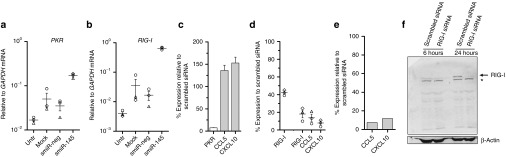
Synthetic microRNAs regulate gene expression when transfected into cells, and may be used in strategies for molecular therapy both in vitro and in vivo. Liposomal transfection reagents are frequently used as delivery vehicles in both settings. Here, we report on the immunological off-target effects observed following liposome transfection of synthetic microRNA-145 into human mesenchymal stem cells and human articular chondrocytes (hAC). The immune response was independent on endosome delivery and toll-like receptors (TLRs) but was mediated by retinoic acid inducible-gene 1 (RIG-I). Upregulation of immune genes required liposomal delivery, as no immune response was observed after electroporation of smiR-145 directly in to the cytosol, suggesting a new role of RIG-I. Immune response was seen both with blunt ended and 2-nucleotide 3' overhang versions of synthetic miR-145, and occurred in the absence of a 5'ppp cap. Mutations in a centrally placed poly (UUUU) sequence reduced, but did not abolish the immune response. Interestingly, exposure to liposomes alone led to upregulation of several immune genes, including RIG-I mRNA. However, this process was not mediated by RIG-I. This insight is important for researchers to avoid unexpected results from gene transfer experiments in vitro and unwanted immune responses following the use of lipid-based transfection reagents in vivo.


Figures

Figure 1
Figure 1
Validation of selected genes upregulated in microarray analysis by RT-qPCR. (a) Expression of CCL5, TLR3, CXCL10, and OAS2 was determined in untransfected cells and after liposome transfection of mock and different smiRs and anti-miRs in hBM-MSCs as indicated in the figure. CCL5 and CXCL10 were also determined following transfection by electroporation. Circle, triangle, and rhombus symbols represent mean values of technical triplicates from three different donors. The mean ± SEM of the biological triplicates are shown by vertical lines. (b) Expression of CCL5, TLR3, CXCL10, and OAS2 in untransfected hAC and after liposome transfection of mock and indicated smiRs. CCL5 and CXCL10 were also determined following transfection by electroporation. Circle and rhombus symbols represent mean values of technical triplicates from two different donors. The mean ± SEM of the biological duplicates are shown by vertical lines. ND, not detected; Untr, untransfected cells.
Figure 2
Figure 2
Cytokine secretion. (a) Concentration of CCL5 and CXCL10 proteins secreted into the culture medium by hBM-MSCs. Technical duplicates were used for each donor. Data are shown as mean ± SEM of the biological triplicates. (b) Concentration of CCL5 and CXCL10 proteins secreted by hACs. Technical duplicates were used for each donor. Data are shown as mean ± SEM of biological duplicates. ND, not detected; Untr, untransfected cells.
Figure 3
Figure 3
Knockdown of TLR signaling and inhibition of endosomal acidification. (a) Cells were treated with scrambled siRNA, TLR3 siRNA, and MYD88 siRNA by electroporation 2 days before liposomal transfection of smiR-145. Before the smiR-145 transfection the TLR3 and MYD88 knockdown were measured using RT-qPCR (white bars) using cells from one hBM-MSC donor and shown as mean ± SD of technical triplicates. CCL5 and CXCL10 mRNA levels were measured 1 day after smiR-145 transfection (gray bars). (b) shows knockdown of TLR3 and MYD88 at the protein level. The effect of different doses of chloroquine on the expression of (c) CCL5 and (d) CXCL10, following smiR-145 liposomal transfection. Circle and rhombus symbols represent mean values of technical triplicates from two donors. Also, 100 µmol/l and 500 µmol/l chloroquine was used, but all cells died at these concentrations and the results are therefore not included. CQ, chloroquine; ND, not detected; Untr, untransfected cells.
Figure 4
Figure 4
Confocal microscopy of smiR delivery. Cells (hBM-MSCs from one donor) were transfected using a FAM-labeled smiR. At indicated time points cells were stained with antibodies against EEA1, CD63, and LAMP1. Green, FAM-labeled smiR; red, EEA1, CD63, or LAMP1; blue, DAPI. Scale bar = 10 µm.
Figure 5
Figure 5
Validation and knockdown of PKR and RIG-I expression. Expression of (a) PKR and (b) RIG-I after transfection of mock and indicated smiRs. hBM-MSCs were treated with scrambled, (c) PKR and (d) RIG-I siRNA by electroporation 2 days before liposomal transfection of smiR-145. Before the smiR-145 transfection, the PKR and RIG-I knockdown was measured using RT-qPCR. CCL5 and CXCL10 mRNA levels were measured 1 day after smiR-145 transfection. In c, the results from one donor are shown as mean ± SD using technical triplicates. In d, the circle, triangle, and rhombus symbols represent mean values of technical triplicates from three different donors. The mean ± SEM of the biological triplicates are shown by vertical lines. In e, the concentration of CCL5 and CXCL10 proteins secreted into the culture medium is shown as the mean ± SEM of the results from two of the donors, showing that protein levels were also efficiently reduced after smiR-145 transfection when the cells had been pretreated with RIG-I siRNA. Technical duplicates were used for each donor. In f, cells were treated with scrambled and RIG-I siRNA by electroporation 2 days before smiR-145 liposomal transfection. Western blotting using antibodies against RIG-I were performed 6 and 24 hours after transfection (one hBM-MSC donor). Predicted molecular weight of RIG-I is 101 kDa. *Non-specific bands. Untr, untransfected cells.
Figure 6
Figure 6
Overexpression and knockdown of RIG-I in 293TN cells. (a) RIG-I mRNA levels were determined after liposomal transfection of mock, smiR-145, control construct (EGFP), and different RIG-I constructs as indicated in the figure. (b) A representative western blotting image using antibodies against RIG-I in untransfected (right lane) and RIG-I–transfected 293 TN cells (full-length RIG-I + GFP, predicted molecular weight approximately 130 kDa). (c) CCL5 and (d) CXCL10 mRNA were measured after liposome transfection of indicated smiRs and plasmids. Protein levels of (e) CCL5 and (f) CXCL10 were measured after liposome transfection of indicated smiRs and plasmids. (g) mRNA and (h) protein levels after liposome cotransfection of RIG-I siRNA and full-length RIG-I plasmids relative to cotransfection of scrambled control siRNA and full-length RIG-I plasmid. mRNA levels (in a, c, d, and g) are shown as mean ± SD from technical triplicates. Protein levels (in e, f, and h) are shown as mean ± SD from technical duplicates. ND, not detected; Untr, untransfected cells.
Figure 7
Figure 7
Induction of immune response using smiR-145 and smiR-145 mutants from Qiagen. (a) CCL5 and CXCL10 were measured after transfection of smiR molecules from Ambion (A) and Qiagen (Q). (b) smiR-642a and smiR-331 from did not lead to immune response (smiRs from Ambion). (c) Mutating the poly (UUUU) of smiR-145 reduced the immune response. Results in a and b are from two different donors and shown as mean ± SD from technical triplicates. In c, circle, triangle and rhombus symbols represent mean values of technical triplicates from three donors. The mean ± SEM of the biological triplicates are shown by vertical lines. Numbers in parentheses indicate % expression relative to smiR-145-Q. ND, not detected; Untr, untransfected cells.
Figure 8
Figure 8
Immune response to liposomes following mock transfection and transfection of smiR-neg and smiR-145 in hBM-MSCs. (a) Quantification of interleukin gene expression of IL6, IL8, and IL1B using RT-qPCR and (b) IL8 protein synthesis using the Luminex system. In a, circle, triangle, and rhombus symbols represent mean values of technical triplicates from three different donors. The mean ± SEM of the biological triplicates are shown by vertical lines. In b, technical duplicates were used for each donor. Data are shown as mean ± SEM of the biological triplicates. In c, cells were treated with scrambled and RIG-I siRNA by electroporation 2 days before liposomal mock transfection. Before the mock transfection, RIG-I knockdown was measured using RT-qPCR. CCL5, CXCL10, IL6, IL8, and IL1B mRNA levels were measured 1 day after mock transfection. Circle, triangle, and rhombus symbols represent mean values of technical triplicates from three different donors. The mean ± SEM of the biological triplicates are shown by vertical lines. Untr, untransfected cells.

References

    1. Hutvágner G, Zamore PD. A microRNA in a multiple-turnover RNAi enzyme complex. Science. 2002;297:2056–2060. - PubMed
    1. Lee RC, Feinbaum RL, Ambros V. The C. elegans heterochronic gene lin-4 encodes small RNAs with antisense complementarity to lin-14. Cell. 1993;75:843–854. - PubMed
    1. Vasudevan S. Posttranscriptional upregulation by microRNAs. Wiley Interdiscip Rev RNA. 2012;3:311–330. - PubMed
    1. Friedman RC, Farh KK, Burge CB, Bartel DP. Most mammalian mRNAs are conserved targets of microRNAs. Genome Res. 2009;19:92–105. - PMC - PubMed
    1. Hornung V, Guenthner-Biller M, Bourquin C, Ablasser A, Schlee M, Uematsu S, et al. Sequence-specific potent induction of IFN-alpha by short interfering RNA in plasmacytoid dendritic cells through TLR7. Nat Med. 2005;11:263–270. - PubMed

Publication types

MeSH terms