. 2013 Jul;23(7):1163-9.
doi: 10.1101/gr.155465.113. Epub 2013 Apr 8.

Country-specific antibiotic use practices impact the human gut resistome

Affiliations

Country-specific antibiotic use practices impact the human gut resistome

Kristoffer Forslund et al. Genome Res. 2013 Jul.

Abstract

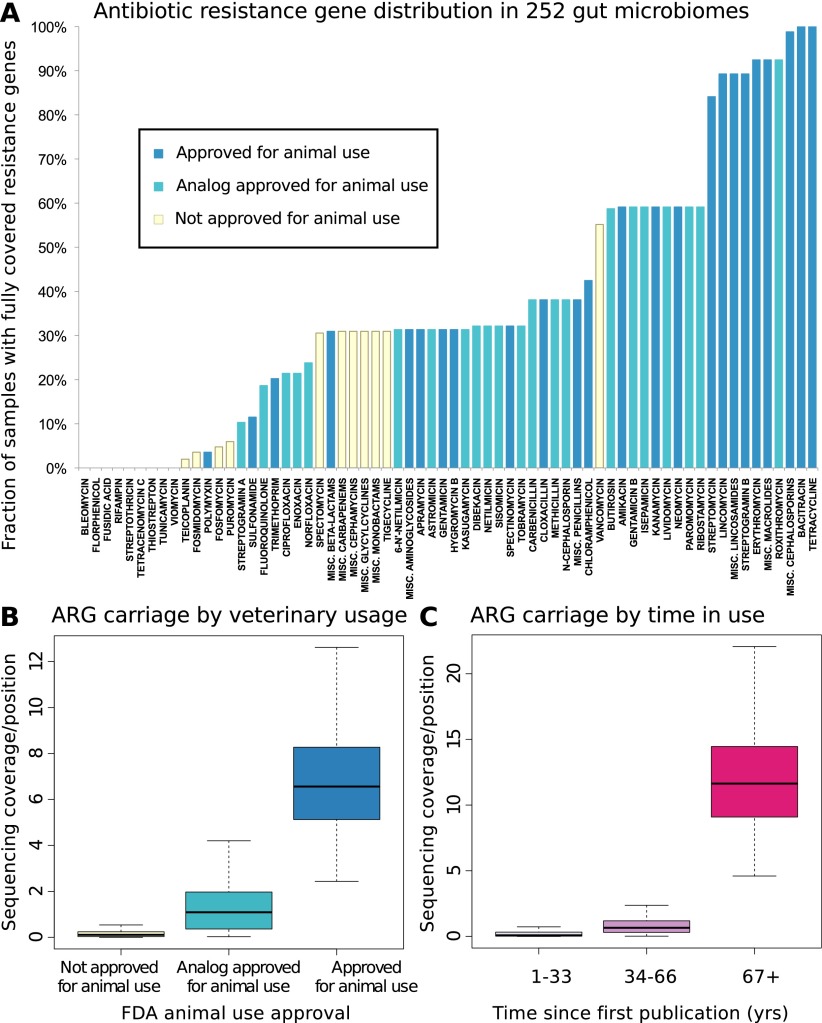
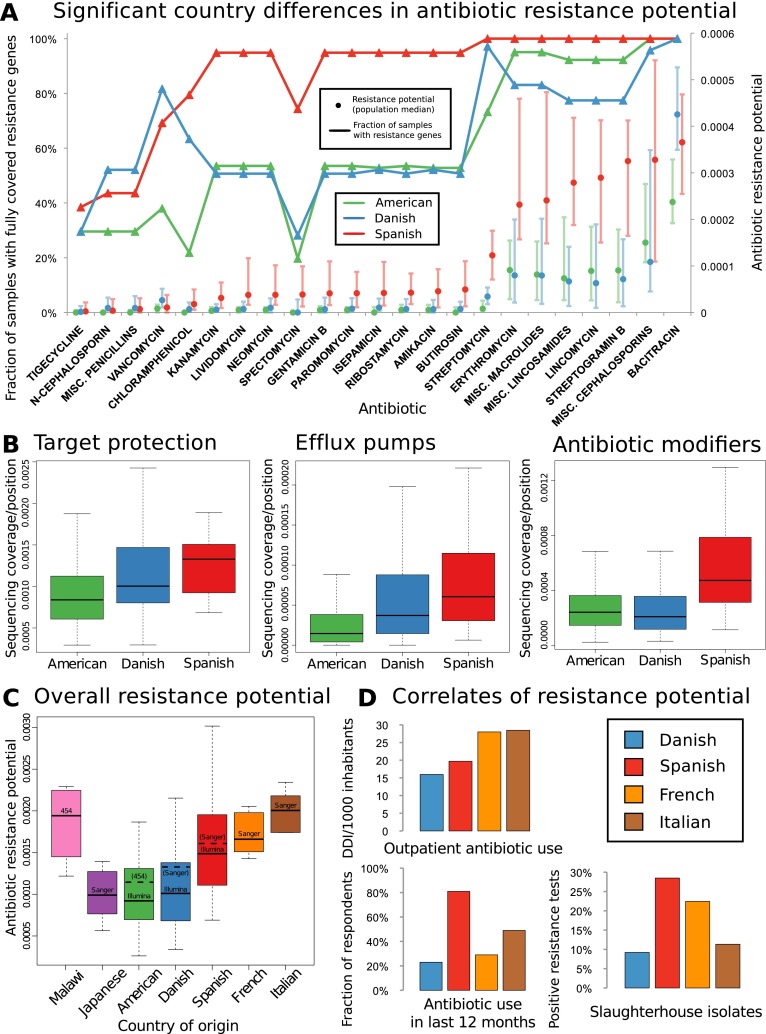
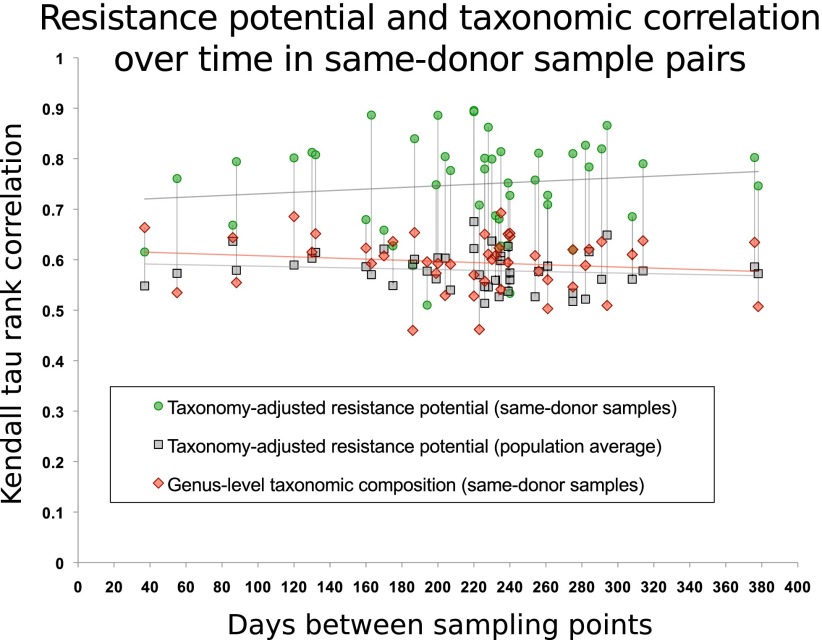
Despite increasing concerns over inappropriate use of antibiotics in medicine and food production, population-level resistance transfer into the human gut microbiota has not been demonstrated beyond individual case studies. To determine the "antibiotic resistance potential" for entire microbial communities, we employ metagenomic data and quantify the totality of known resistance genes in each community (its resistome) for 68 classes and subclasses of antibiotics. In 252 fecal metagenomes from three countries, we show that the most abundant resistance determinants are those for antibiotics also used in animals and for antibiotics that have been available longer. Resistance genes are also more abundant in samples from Spain, Italy, and France than from Denmark, the United States, or Japan. Where comparable country-level data on antibiotic use in both humans and animals are available, differences in these statistics match the observed resistance potential differences. The results are robust over time as the antibiotic resistance determinants of individuals persist in the human gut flora for at least a year.


Figures

Figure 1.
Figure 1.
(A) Resistance gene penetration is higher for antibiotics approved for use in animals or with analogs that have such approval. Shown is the fraction of 252 gut samples where at least one resistance-associated gene is fully covered by sequencing, for members of 66 classes or subclasses (with the most narrow subclasses being single compounds, see Methods) of antibiotics represented in the Antibiotic Resistance Genes Database (ARDB) (Supplemental Table S1), and for which the time since introduction and animal usage approval information was available. The colors of the bars represent whether or not animal use has been approved by the U.S. FDA according to the “Green Book” database (Shields 2009), and whether or not such use is approved for any close analogs of each antibiotic. (B) Antibiotics approved for animal use have significantly (Kruskal-Wallis test for categories having same median, P < 2 × 10⁻¹⁶) higher resistance potential in our data set. The figure shows base coverage per site for resistance genes assigned to categories based on animal use approval. To control for different numbers of known resistance genes targeting each antibiotic (Supplemental Table S1), the average over all resistance gene families are taken. The box plots represent the 252 Illumina samples. (C) Antibiotics that have been longer in use have significantly (Kruskal-Wallis test for categories having same median, P < 2 × 10⁻¹⁶) higher resistance potential in our data set. The figure shows base coverage per site for resistance genes assigned to categories based on how long the antibiotics they protect against have been in use, estimated from the time since first publication for each compound. If an antibiotic has analogs, the age of the oldest analog is used to account for cross-resistances (Supplemental Table S1). The box plots represent the 252 Illumina samples.
Figure 2.
Figure 2.
(A) Geographic differences in antibiotic resistance potential. For several antibiotics, strong and significant country differences in the respective resistance gene penetration and taxonomy-adjusted resistance potential are observed, whereby mostly those of Spanish individuals are higher than those of U.S. or Danish individuals. Antibiotics with significantly different resistance distribution between Danish (N = 71), Spanish (N = 39), and American (U.S.) (N = 142) samples are displayed, with general resistance to broad classes represented by including “miscellaneous” or “generic” members of those classes subject only to resistance from the genes with the more general annotation (see Methods). To account for cross-resistances, a multiple testing correction procedure was chosen which does not assume independence between the resistance potentials of different antibiotics (Benjamini and Yekutieli 2001). Most antibiotics that show significant country differences are approved for animal use or have analogs that are, although this is not a significant enrichment over the full set of antibiotics. All samples were stochastically down-sampled to the size of the smallest sample (∼726 Mbp) prior to the analysis. The lines/triangle markers represent the fraction of samples from each country where at least one resistance gene is fully covered by sequencing. The dot/bar markers represent median and 25%/75% quartiles for resistance potential, measured as the total resistance gene abundance for each antibiotic relative to the amount of genetic material in each sample that comes from species where any resistance genes are found. (B) Significant country differences are seen separately for antibiotic resistance genes acting by different mechanisms (Kruskal-Wallis test for countries having same median, P [drug modification] < 1.98 × 10⁻⁸, P [efflux] < 6.68 × 10⁻⁹, P [target protection] < 4.17 × 10⁻⁵). The figures show base coverage per site for resistance genes assigned to categories based on whether they operate by modifying antibiotic molecules, protecting cellular target sites, or exporting antibiotic molecules from bacterial cells. The average is taken over the resistance genes in each category, with the boxes representing the 142 American, 71 Danish, and 39 Spanish samples, respectively. (C) The higher resistance potential in Spanish than in Danish samples is also seen in other samples from southern Europe (France, Italy). The distributions are significantly different between these four countries (Kruskal-Wallis P < 1.07 × 10⁻⁵). Results are broadly in agreement between different sequencing platforms (see Supplemental Text). The samples were stochastically down-sampled to 50 Mbp prior to the analysis. (D) Gut resistance potential coincides with antibiotic exposure when comparing Denmark with southern Europe. The bar charts show comparative statistics from the literature: outpatient antibiotic consumption in 2008 from the same four countries (European Surveillance of Antimicrobial Consumption [ESAC] survey) (Goossens et al. 2005) measured in defined daily doses (DDDs) per 1000 inhabitants, frequency of antibiotic resistance in bacterial isolates from slaughterhouses in a 2011 comparative study (de Jong et al. 2012), and fraction of approximately 1000 respondents in each country that had taken antibiotics during the last 12 mo (Borg 2012). Resistance potential correlates significantly with outpatient antibiotic use (Pearson r = 0.97; t-test [N = 4, df = 2]; Bonferroni-corrected P < 0.08).
Figure 3.
Figure 3.
Antibiotic resistance potential persists over time in the human gut flora for at least a year. For 43 U.S. individuals, two or three time points were sampled (The Human Microbiome Project Consortium 2012). Each interval (measured in days) between two sampled time points is represented by a green dot. For each such pair of samples, they are compared with respect to carriage of 99 resistance gene families from ARDB that are detectable in the gut samples, using the Kendall τ correlation coefficient, following compensation for sequencing depth and differences in species composition. The gray dots represent the average correlation between either of the two samples and the remaining 137 HMP samples in the data set. Red markers show the Kendall τ correlation coefficient for genus-level taxonomic composition profiles. Vertical lines connect values for each sample. Linear regression of similarity of same-donor sample pairs with respect to the time interval yields no notable decrease in resistance potential similarity within the time spans considered here (R2 < 0.015). Previous studies (Costello et al. 2009; The Human Microbiome Project Consortium 2012) have shown that the composition of a person's gut microbiome as a whole is self-similar during a year compared with that of other people. In almost every case, resistance potentials are better conserved than overall taxonomic composition.

References

    1. Aarestrup F 2012. Sustainable farming: Get pigs off antibiotics. Nature 486: 465–466 - PubMed
    1. Agersø Y, Lester CH, Porsbo LJ, Orsted I, Emborg H-D, Olsen KEP, Jensen LB, Heuer OE, Frimodt-Møller N, Aarestrup FM, et al. 2008. Vancomycin-resistant Enterococcus faecalis isolates from a Danish patient and two healthy human volunteers are possibly related to isolates from imported turkey meat. J Antimicrob Chemother 62: 844–845 - PubMed
    1. Arumugam M, Raes J, Pelletier E, Paslier DL, Yamada T, Mende DR, Fernandes GR, Tap J, Bruls T, Batto J-M, et al. 2011. Enterotypes of the human gut microbiome. Nature 473: 174–180 - PMC - PubMed
    1. Bager F, Madsen M, Christensen J, Aarestrup FM 1997. Avoparcin used as a growth promoter is associated with the occurrence of vancomycin-resistant Enterococcus faecium on Danish poultry and pig farms. Prev Vet Med 31: 95–112 - PubMed
    1. Barbosa TM, Levy SB 2000. The impact of antibiotic use on resistance development and persistence. Drug Resist Updat 3: 303–311 - PubMed

Publication types

Substances

LinkOut - more resources