. 2013 Apr 23;110(17):6853-8.
doi: 10.1073/pnas.1216436110. Epub 2013 Apr 8.

Majority of differentially expressed genes are down-regulated during malignant transformation in a four-stage model

Affiliations

Majority of differentially expressed genes are down-regulated during malignant transformation in a four-stage model

Frida Danielsson et al. Proc Natl Acad Sci U S A. .

Erratum in

Abstract

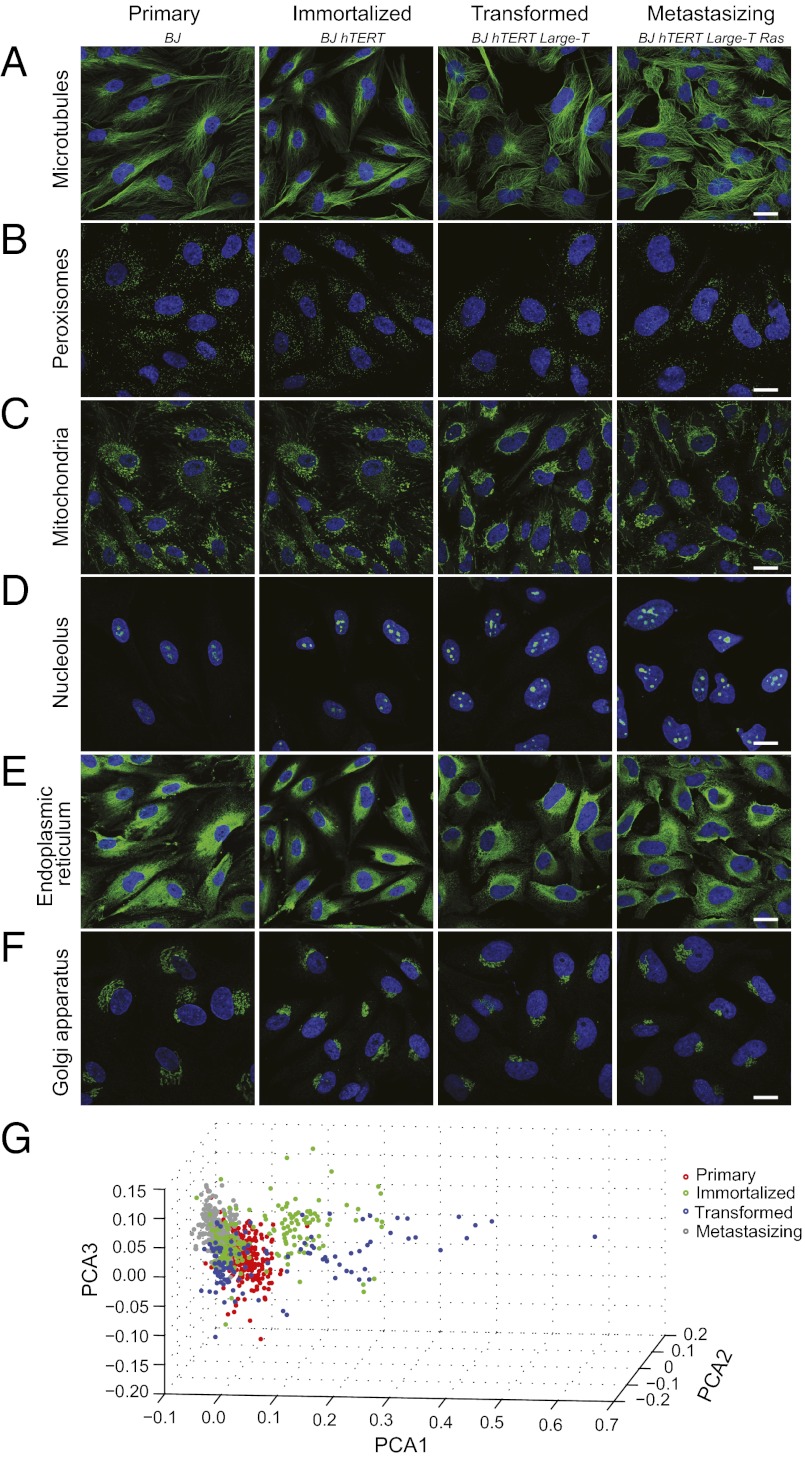
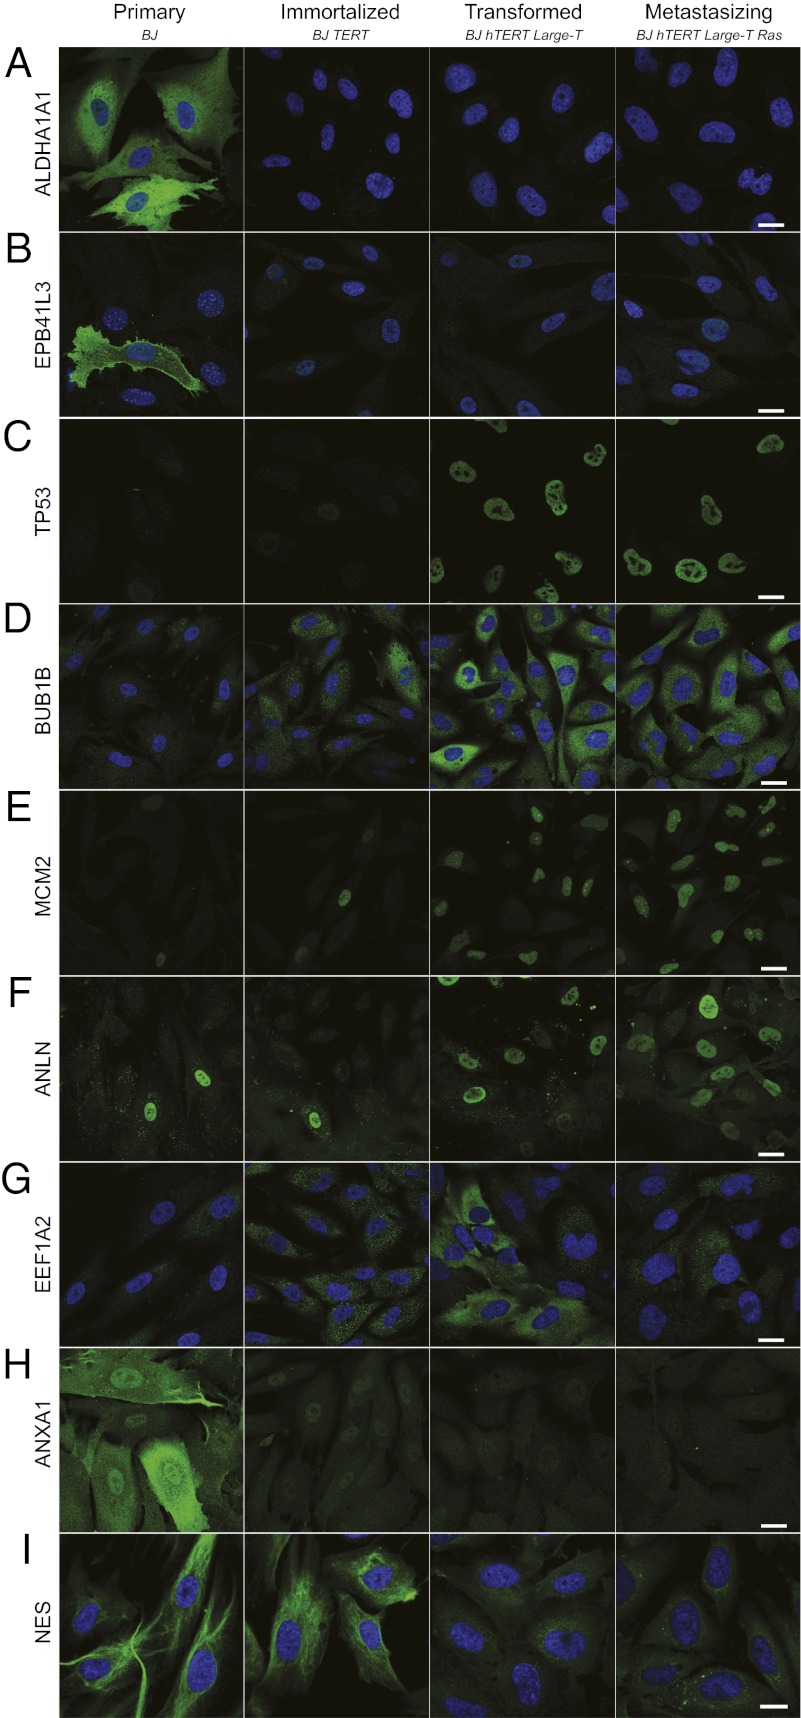
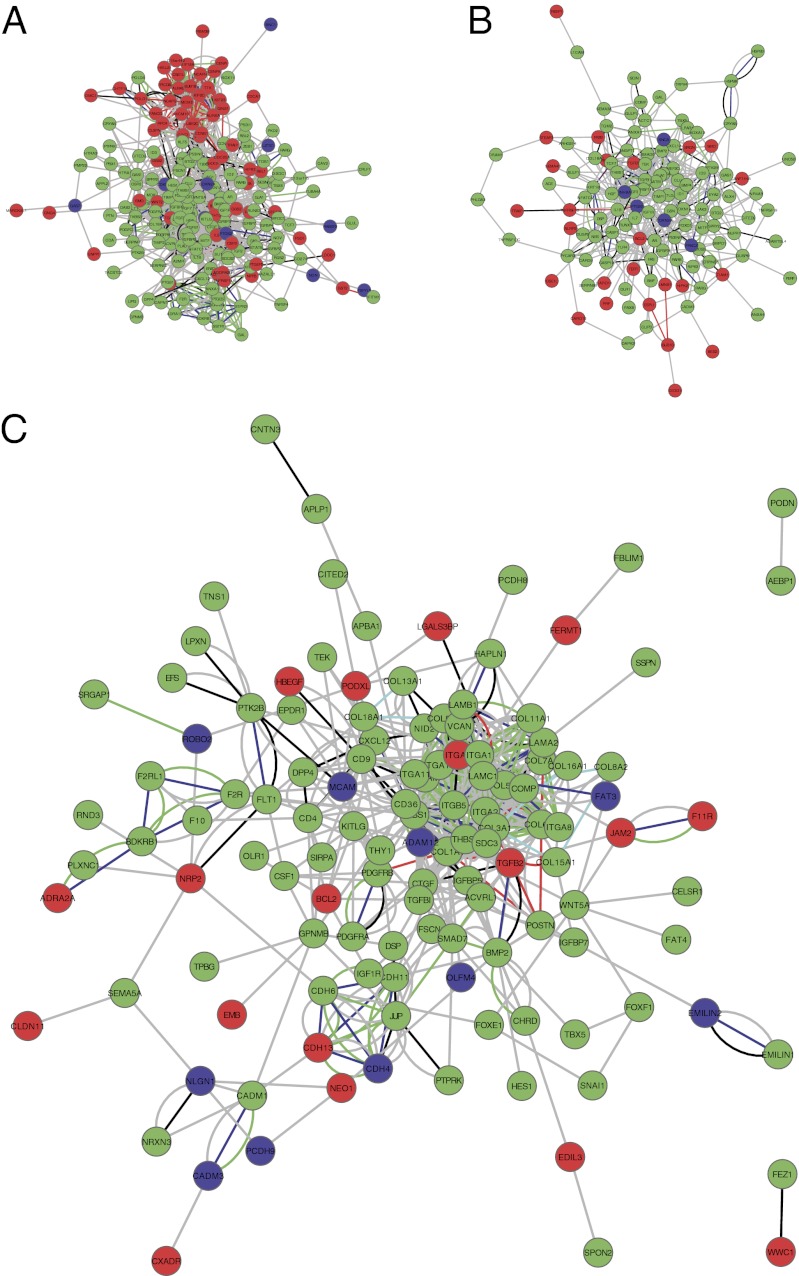
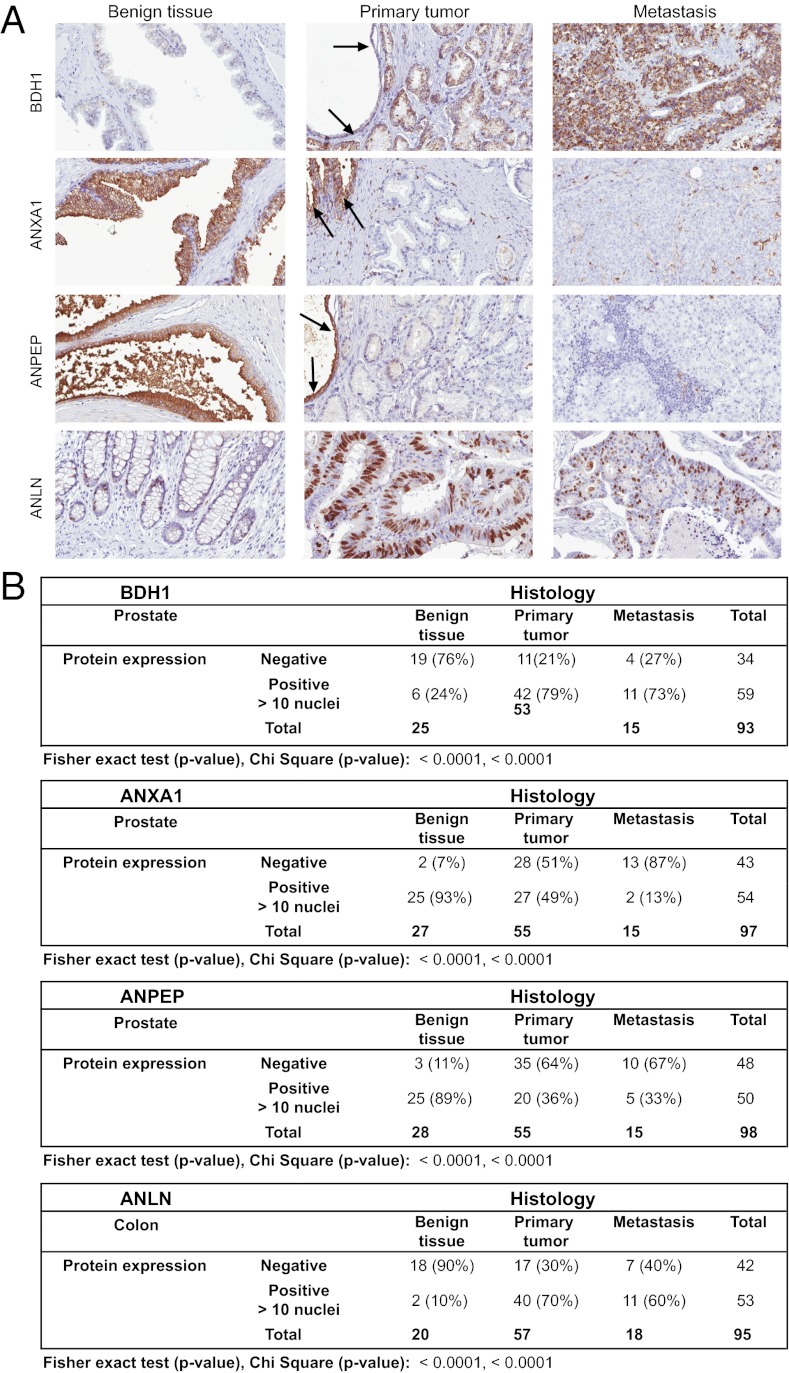
The transformation of normal cells to malignant, metastatic tumor cells is a multistep process caused by the sequential acquirement of genetic changes. To identify these changes, we compared the transcriptomes and levels and distribution of proteins in a four-stage cell model of isogenically matched normal, immortalized, transformed, and metastatic human cells, using deep transcriptome sequencing and immunofluorescence microscopy. The data show that ∼6% (n = 1,357) of the human protein-coding genes are differentially expressed across the stages in the model. Interestingly, the majority of these genes are down-regulated, linking malignant transformation to dedifferentiation. The up-regulated genes are mainly components that control cellular proliferation, whereas the down-regulated genes consist of proteins exposed on or secreted from the cell surface. As many of the identified gene products control basic cellular functions that are defective in cancers, the data provide candidates for follow-up studies to investigate their functional roles in tumor formation. When we further compared the expression levels of four of the identified proteins in clinical cancer cohorts, similar differences were observed between benign and cancer cells, as in the cell model. This shows that this comprehensive demonstration of the molecular changes underlying malignant transformation is a relevant model to study the process of tumor formation.


Conflict of interest statement

The authors declare no conflict of interest.

Figures

Fig. 1.
Fig. 1.
Morphological analysis of the cell model. (AF) Confocal images of immunofluorescently stained cells, where the organelle of interest is shown in green and the nucleus is in blue. The images show staining of the following structures (targeted protein): (A) microtubules (TUBA1A), (B) peroxisomes (ABCD3), (C) mitochondria (HSPA9), (D) nucleolus (USP36), (E) endoplasmic reticulum (CALR), and (F) Golgi apparatus (GOLGA5). (Scale bars, 20 μm.) (G) Scatter plot, using the first three principal components and representation of the four cell stages in the model. The principal component analysis (PCA) was run on the top 50 ranked texture and morphological features from images with IF staining of the nucleus, microtubules, and Golgi apparatus.
Fig. 2.
Fig. 2.
Overall changes in gene expression across the cell model. (A) Schematic of the cell-line model based on accumulative genetic changes, with summarized RNA-seq results shown below the cells. The introduced genetic changes could be validated by the RNA-seq data as follows for TERT (FPKM), large-T (FPKM), and RasG12V (fraction of reads with mutation, in %) in the four cell lines, respectively: primary: 0, 0, 0; immortalized: 128, 1, 0; transformed: 85, 2219, 0; metastasizing: 103, 2685, 30. (B) Graph showing the over- or underrepresentation of annotated subcellular localization for the group of differentially expressed genes compared with all detected genes. The subcellular structures are listed on the y axis and the differences in percentage points between the differentially expressed genes and all detected genes are shown on the x axis (i.e., overrepresented organelles have a positive value).
Fig. 3.
Fig. 3.
Confocal images of immunofluorescently stained proteins with differential expression. The protein of interest is shown in green and the nucleus is in blue. The images show staining of the following proteins (corresponding FPKM values): (A) ALDH1A1 (256, 0, 0, 0), (B) EPB41L3 (13.8, 0, 0, 0), (C) TP53 (16.6, 33.8, 73.1, 65.2), (D) BUB1B (11.3, 19.1, 41.7, 41.8), (E) MCM2 (34.8, 41.1, 103, 108), (F) ANLN (99.2, 142, 250, 237), (G) EEF1A2 (18.8, 3.74, 154. 29.7), (H) ANXA1 (526, 440, 253, 201), and (I) NES (105, 93.9, 1.85, 4.27). For images DF, the DAPI channel is available in Fig. S2. (Scale bars, 20 μm.)
Fig. 4.
Fig. 4.
Functional interaction networks for differentially expressed genes assigned to the following categories: (A) cell-cycle process, (B) apoptosis, and (C) cell adhesion and migration. Nodes are colored based on the gene expression pattern: down-regulation (green), up-regulation (red), and mixed pattern (blue). Edges are colored based on the source of information: coexpression (red), co-occurrence (light blue), experimental (black), fusion (purple), homology (dark blue), green (knowledge), and gray (text mining).
Fig. 5.
Fig. 5.
(A) Examples of immunohistochemically stained sections from benign glands, primary tumor, and metastasis of colon (ANLN) or prostate (BDH1, ANXA1, and ANPEP). The specific protein staining is shown in brown. Arrows mark concomitant normal prostatic glands adjacent to growth of primary prostate cancer. (B) Summarized results from manual assessment of IHC stained prostate tissue biopsies.

References

    1. Fearon ER, Vogelstein B. A genetic model for colorectal tumorigenesis. Cell. 1990;61(5):759–767. - PubMed
    1. Land H, Parada LF, Weinberg RA. Cellular oncogenes and multistep carcinogenesis. Science. 1983;222(4625):771–778. - PubMed
    1. Hanahan D, Weinberg RA. The hallmarks of cancer. Cell. 2000;100(1):57–70. - PubMed
    1. Hanahan D, Weinberg RA. Hallmarks of cancer: The next generation. Cell. 2011;144(5):646–674. - PubMed
    1. Cancer Genome Atlas Research Network Integrated genomic analyses of ovarian carcinoma. Nature. 2011;474(7353):609–615. - PMC - PubMed

Publication types

MeSH terms

LinkOut - more resources